


50 things we now know about digital health consumers
For full access to the survey data, report, and all of our research, become a Rock Health partner—email partnerships@rockhealth.com.
Consumers of healthcare have historically been one step removed from the industry. Most often positioned as passive stakeholders, consumers are faced with complex and asymmetrical information in a system plagued with rising prices and higher deductibles. As patient-driven care gradually replaces a culture of medical paternalism, patients are increasingly in the driver’s seat of their own health. And just as the Internet has changed the way we learn, communicate, shop, bank, and work, so too is it changing the way we manage our own health and healthcare.
NPR’s Planet Money recently noted, “Healthcare is this totally ‘weird’ and different part of our economy.” We’ve noticed—which is why we love digging into how the industry is being shaken up by technology. Our second annual 4,000+ person nationally-representative survey is full of insights and valuable data. We deploy this survey each year to better understand consumer sentiment and adoption of digital health, reveal consumer attitudes toward health privacy and trust, and gauge overall consumer behavior (see our 2015 report here).
A tipping point in consumer health
- Digital health reached a tipping point in 2016 as consumers adopted digital health tools at a record rate over the last 12 months. Forty-six percent of consumers are now considered active digital health adopters, having used three or more categories of digital health tools (e.g., telemedicine, wearables)—up from 19% in 2015. Only 12% of Americans are non-adopters, down from 20% in 2015.
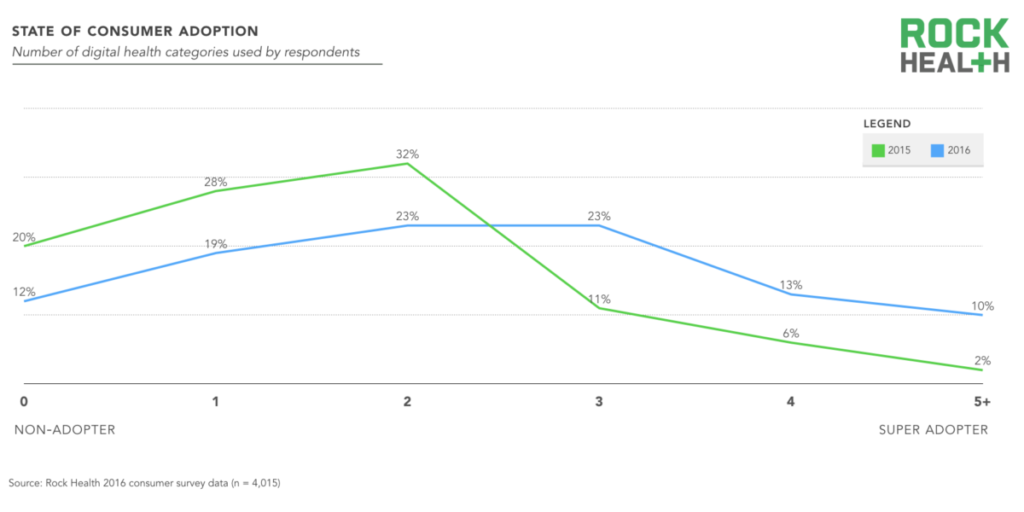
Source: Rock Health consumer survey data (n = 4,015)
- Consumer willingness to pay saw a dramatic threefold increase from 2015, with 39% of consumers strongly agreeing that they are willing to pay for health expenses out of pocket. This parallels the increase in consumers purchasing high-deductible health insurance plans, which rose from 20% in 2014 to 29% in 2016 (Kaiser Family Foundation).
- Even novel consumer technologies like virtual and augmented reality are being adapted for health uses such as relaxation (7%), mental health (4%), rehabilitation (3%), and pain management (3%).
- A majority of Americans are interested in obtaining an electronic copy of their health record, and 20% have asked for or downloaded a copy in the last six months. This broad, consumer-driven push for health data digitization and ownership is ushering healthcare out of the analog era.
- While consumers are concerned about the privacy and security of their health data, the vast majority (77%) are interested in sharing their health information, especially to get better care from their doctor.
- Health data ownership and control is important to consumers, and sharing of healthcare information is seen as acceptable only in specific use cases. Nearly 87% state that they should be in control of who has access to their health data, and almost 86% say they should be told what health data is collected about them.
- Americans are more altruistic than they are greedy—more people would freely share their health data to contribute to medical research (62%) than would share their data in exchange for money (42%).
- Physicians and family members are the two entities most trusted to keep health data private, while the government and tech companies are the least trusted.
- Similarly, when asked which health entities are most aligned with consumers’ health interests, physicians rank at the top and the government and technology companies closely rank at the bottom.
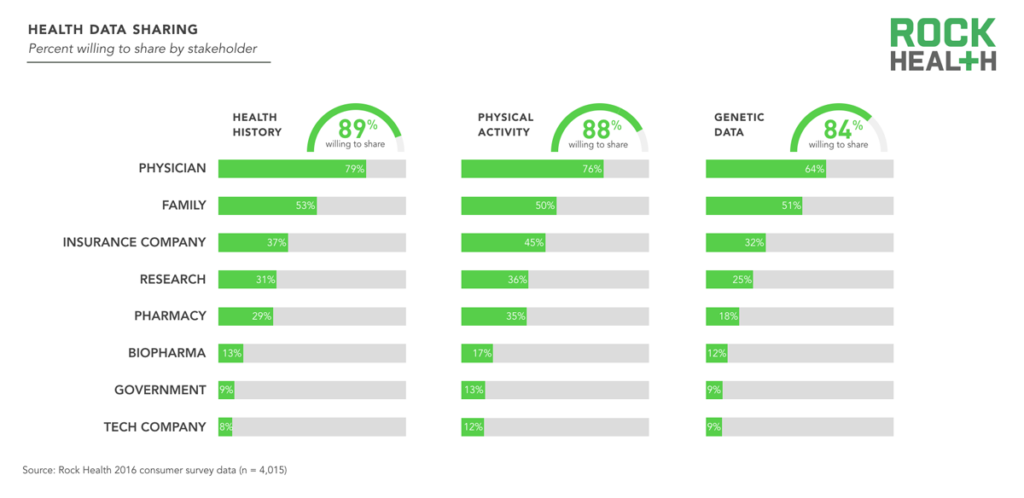
Source: Rock Health consumer survey data (n = 4,015)
- Despite starting up and shutting down several efforts in digital health, Google has consistently ranked as the most trusted tech company in this space. On the other hand, social media monolith Facebook and Watson-creator IBM are the least trusted tech companies.
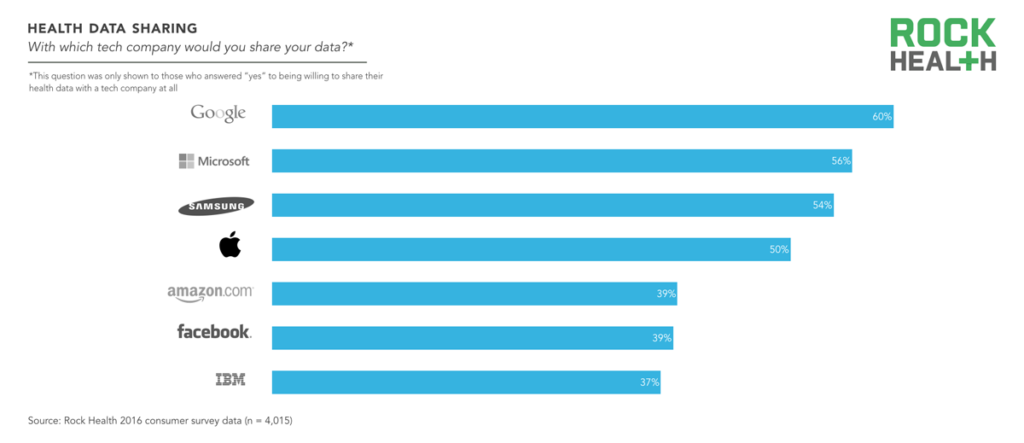
Source: Rock Health consumer survey data (n = 4,015)
Quantify thyself
- The majority of health tracking is done mentally—54% of people who track weight and 58% of people who track medications do so in their heads.
- Of those tracking their health, the most common metrics recorded using an app are physical activity (44%) and heart rate (31%).
- The factors least likely to be recorded in an app are blood pressure (14%) and medication adherence (10%).
- Of those who have downloaded health apps, most have done so after discovering the app online or in the app store (41%).
- Nearly a third of people who downloaded a health app did so because the app was recommended by their doctor.
Part of the problem is that virtual care is disconnected from payers and providers. It may offer immediacy, but it doesn’t help longitudinally in managing the overall patient journey.
Wearables climb the adoption curve
- Nearly a quarter of Americans own a wearable, up from 12% in 2015.
- The most popular wearable device manufacturers for all ages are Samsung (30%), Fitbit (26%), and Apple (22%).
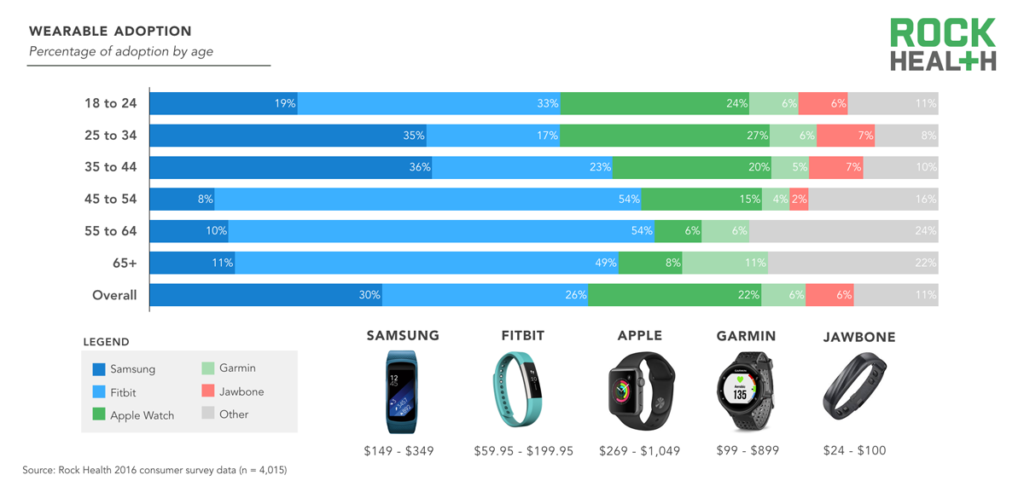
Source: Rock Health consumer survey data (n = 4,015)
- Seventy-five percent of wearable owners purchased the wearable for themselves, 22% received the wearable as a gift, and fewer than 2% received the device from their employer.
- Of those who bought their wearable, a third did so in the last three months and two thirds made the purchase in the last six months.
- A majority of wearable owners made the purchase to “become more physically active”; other reasons include to lose weight, get better sleep, and better manage stress.
People would be more inclined to use wearables and track their health if they knew their physician was using that information and it directly impacted their clinical care.
An impressive growth year for telemedicine
- Video-based telemedicine adoption more than tripled from 7% in 2015 to 22% in 2016, with the majority of uses occurring in the last three months.
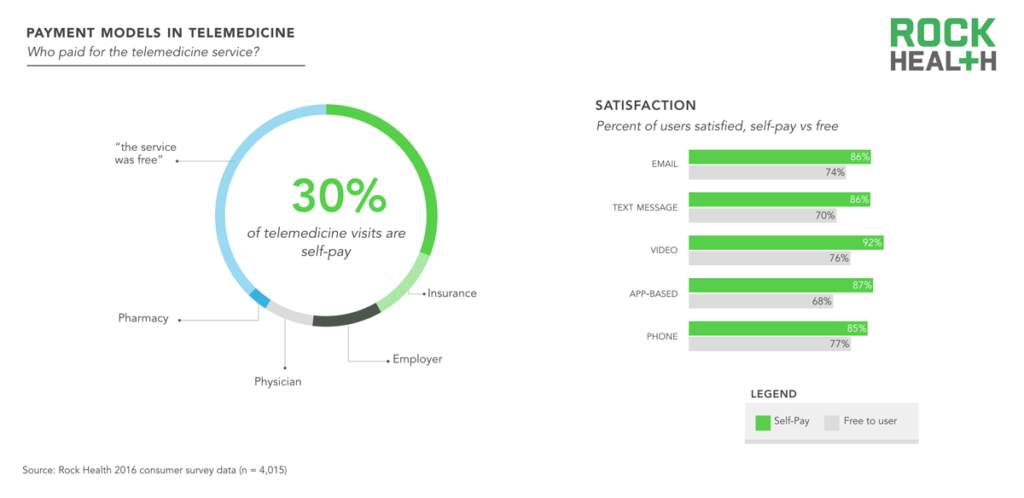
- Thirty percent of telemedicine visits are self-pay, compared to visits covered by insurance (11%) and employers (10%).
Source: Rock Health consumer survey data (n = 4,015)
The most challenging barrier to adoption is that this is an industry where the payer is not ultimately the end-user of the technology they pay for. As a result, there are numerous stakeholders (payer, provider, user) that must buy-in before an idea is commercially viable.
- The most popular telemedicine medium is telephone (59%), followed by email (41%) and SMS (29%).
- The telemedicine medium with the highest satisfaction rate is live video, for which 83% of consumers expressed moderate or extreme satisfaction.
- Across all telemedicine platforms, satisfaction rates are above 75%. Consumers who self-pay for the service are more satisfied across the board.
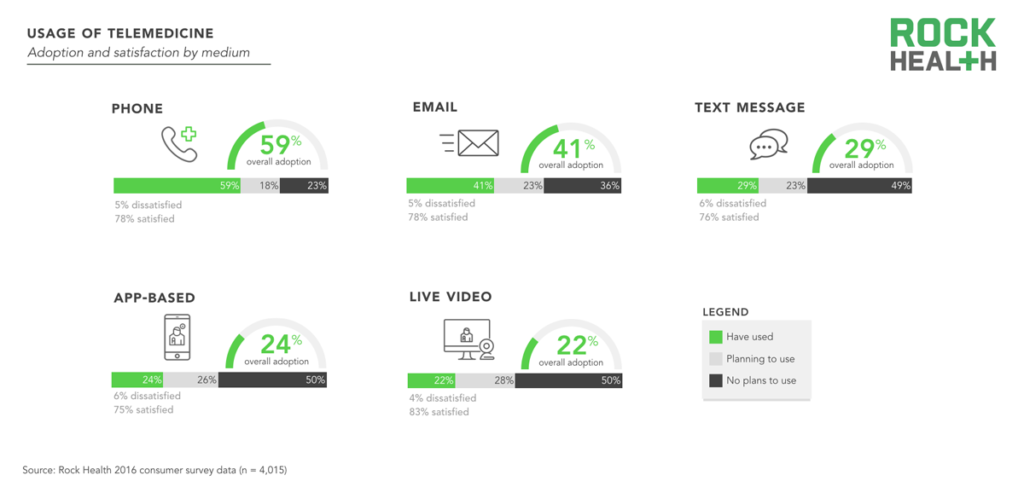
- Over a quarter of consumers plan to use live video to receive medical care or electronically send a picture or video to their healthcare provider in the future.
- Usage of telemedicine is highest amongst the 25-34 age bracket across all mediums, followed by the 35-44 age bracket. Baby Boomers (55+) are the least likely age group to have used telemedicine, although more than half have sought virtual medical care with a provider through a live telephone call.
If we were to reimburse the use of digital health technologies, that would drive a meaningful increase in adoption. Insurers will get on board once these tools are shown to reduce costs and consumption of resources.
Patients continue to leverage Dr. Google
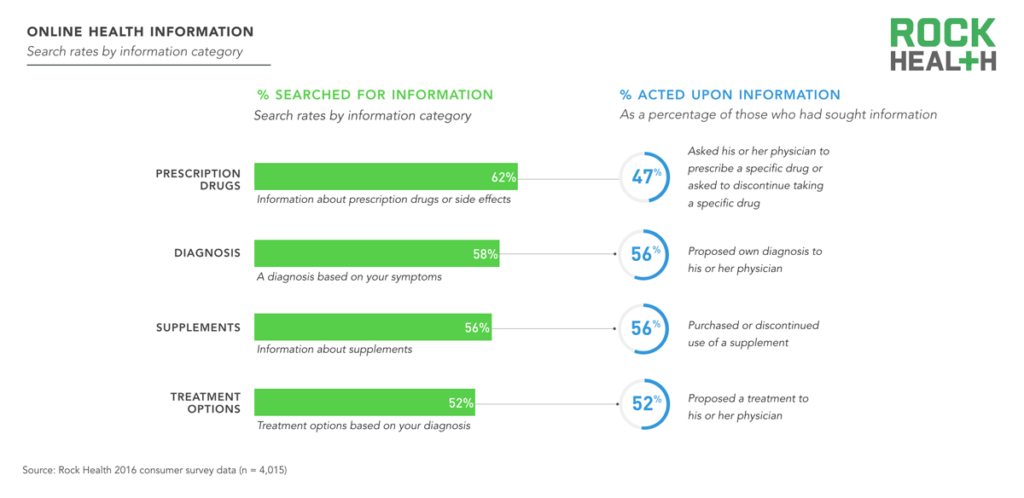
- Fifty-six percent of Americans who searched online for information about their symptoms have then proposed their own diagnosis to their physician based on that information (we hear doctors love this!).
- Sixty-two percent of Americans have used the Internet to search for information about prescription drugs.
- Nearly half of Americans who have searched online for health information have asked their physician to prescribe or discontinue taking a specific drug based on information found.
- A third of Americans have used the Internet to gather information about supplements in the last six months. Our own Labdoor provided 5M users with data analysis on 750+ supplements in 2016.
- Fifty-six percent of Americans who sought information online about supplements have purchased or discontinued use of a supplement based on the information found.
Source: Rock Health consumer survey data (n = 4,015)
- Over a third of Americans have written an online review about a specific provider. Health-focused review sites such as ZocDoc or Healthgrades are slightly more popular than general review sites like Yelp.
- When searching online for a physician, the most important factors for Americans are quality of care, closely followed by insurance coverage, and location. Cost is rated the least helpful type of data.
- When searching online for a pharmacy, location is by far the most important factor, followed by price and insurance coverage.
Consumers need to see cost, quality, and access in one place for their searches for providers to be meaningful and actionable.
Is digital health only for digital natives?
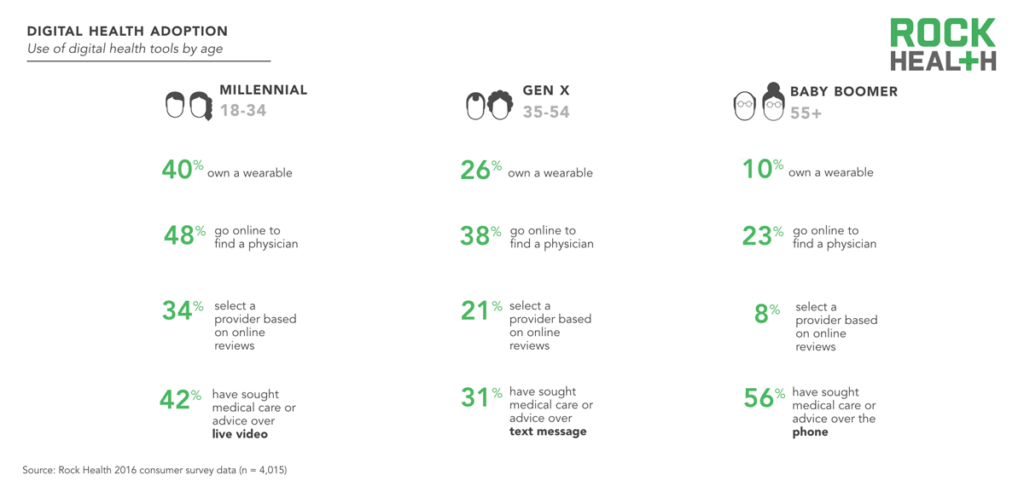
- Forty percent of millennials (18-34) own a wearable, compared to 26% of Gen Xers (35-54) and only one in ten baby boomers (55+).
- Technology companies still have a long way to go in gaining the trust of one of healthcare’s largest consumer groups: seniors. While 84% of those aged 55 and older trust their physician to keep their health data secure, only 19% trust a technology company to do so. Comparatively, 82% of those under 55 trust their physician and 38% trust a technology company with their health information.
- Forty-two percent of millennials have used synchronous video telemedicine, compared to just a quarter of Gen Xers and under 5% of Baby Boomers.
- About half of millennials have emailed with a doctor, while a quarter of baby boomers have done the same.
- Synchronous phone calls are the most popular medium for seeking medical care or advice virtually across all ages, while synchronous video visits are the least popular medium.
- Only 5% of those aged 55+ have used live video in the past year, and only 3% indicate that they plan on using the technology in the future.
- Millennials are the most likely to have asked for a download or electronic copy of their health records (45%), compared to nearly a third of Gen Xers and a quarter of baby boomers.
- The most popular method for baby boomers to track health across all categories is in their head; but for those who do use an app, 25% are tracking physical activity, 17% are tracking sleep, and 10% are tracking heart rate.
- A third of millennials have downloaded a health app in the last 30 days, compared to 20% of Gen Xers and 7% of baby boomers.
Source: Rock Health consumer survey data (n = 4,015)
In sickness and in health: digital health adoption varies across health status
Respondents who self-rated their health status as poor or bad are included in the “poor health” category. Respondents who self-rated their health status as moderate, good, or excellent are included in the “good health” category.
- Those in poor health are more willing to share their health history with all stakeholders than those in good health. Notably, they are 12% more likely to share that information with their pharmacy, and 11% more likely to share it with their physician.
- Only 8% of consumers who rated their health as poor purchased a wearable in the last year. Of those, 53% decided to make the purchase as an experiment, 42% to become more physically active, and 35% to lose weight.
- Access to health information especially matters to those with poor health—28% very much wanted an electronic copy of their health records, while only 19% of those in good health are as interested.
- Those who rated themselves in good health are 12% more likely to propose their own diagnosis to their physician and 7% more likely to propose a treatment based on information found online.
- While 18% of those in good health decided to use a health app because their insurance company recommended it, only 3% of those in poor health decided to do so.
- The healthy are much more active in reviewing the people and places they and their loved ones go to for care. They most often write reviews for in-home caregivers and nurses (64%), nursing homes and long term care facilities (61%), and physical therapists (55%).
People don’t say ‘I want to be adherent,’ but I want to save time, save money, and be healthy. The consumer goal is often different from the industry goal, and the opportunity is at the intersection of those two.
For full access to our research, insights, and experts, become a Rock Health partner—email partnerships@rockhealth.com.
Acknowledgements
This report would not have been possible without the help of a number of industry partners and startup entrepreneurs who have graciously shared their expertise, including John Brownstein, Mia Ferrara, Alejandro Foung, Noah Lang, Matt Murphy, Vijay Patel, Rich Roth, Eric Topol, and David Vivero.
We also want to give a special acknowledgement to the diligent and insightful researchers Malay Gandhi and Teresa Wang, who laid the groundwork in our original 2015 report. Without their work, this second annual report would not be possible.