

Digital health funding: 2014 year in review
Morbi leo risus, porta ac consectetur ac, vestibulum at eros. Donec ullamcorper nulla non metus auctor fringilla. Nullam id dolor id nibh ultricies vehicula ut id elit. Vestibulum id ligula porta felis euismod semper. Nullam quis risus eget urna mollis ornare vel eu leo. Nulla vitae elit libero, a pharetra augue. Sed posuere consectetur est at lobortis. Aenean eu leo quam. Pellentesque ornare sem lacinia quam venenatis vestibulum. Praesent commodo cursus magna, vel scelerisque nisl consectetur et. Nulla vitae elit libero, a pharetra augue. Aenean lacinia bibendum nulla sed consectetur. Vestibulum id ligula porta felis euismod semper. Nullam quis risus eget urna mollis ornare vel eu leo. Nullam quis risus eget urna mollis ornare vel eu leo. Donec id elit non mi porta gravida at eget metus. Lorem ipsum dolor sit amet, consectetur adipiscing elit. Etiam porta sem malesuada magna mollis euismod. Fusce dapibus, tellus ac cursus commodo, tortor mauris condimentum nibh, ut fermentum massa justo sit amet risus. Fusce dapibus, tellus ac cursus commodo, tortor mauris condimentum nibh, ut fermentum massa justo sit amet risus.
Despite this being our fourth full year of tracking digital health funding and our eighth report on the subject, we were still surprised when venture funding exceeded $4B. The figure is staggering in many contexts—125% growth over 2013, four times the total from just three years ago, and nearly exceeding the sum of the last three years together.
For the record, we don’t believe there is a bubble. We are fortunate to work with world-class entrepreneurs building sustainable companies in healthcare and see growth in funding as a reflection not only of their early success but also of the long, capital-intensive road ahead. As we begin 2015, it is obvious that our healthcare system is undergoing a technology-based transformation, with health reform serving as a massive tailwind. Entrepreneurs (and investors) are taking note (and advantage).
With the growth in venture funding comes the obvious question of exits. We tracked 95 overall M&A deals and about $20B in disclosed M&A activity over the year, and another $10B in market cap created through IPOs. Public market performance both in new offerings and existing was weak in 2014, and the sector needs name brand companies that have taken on significant venture capital to find their way to an exit.
It’s likely that 2015 will be an even bigger year than 2014. More deals, more exits. Stay tuned.
Dollars and Deals
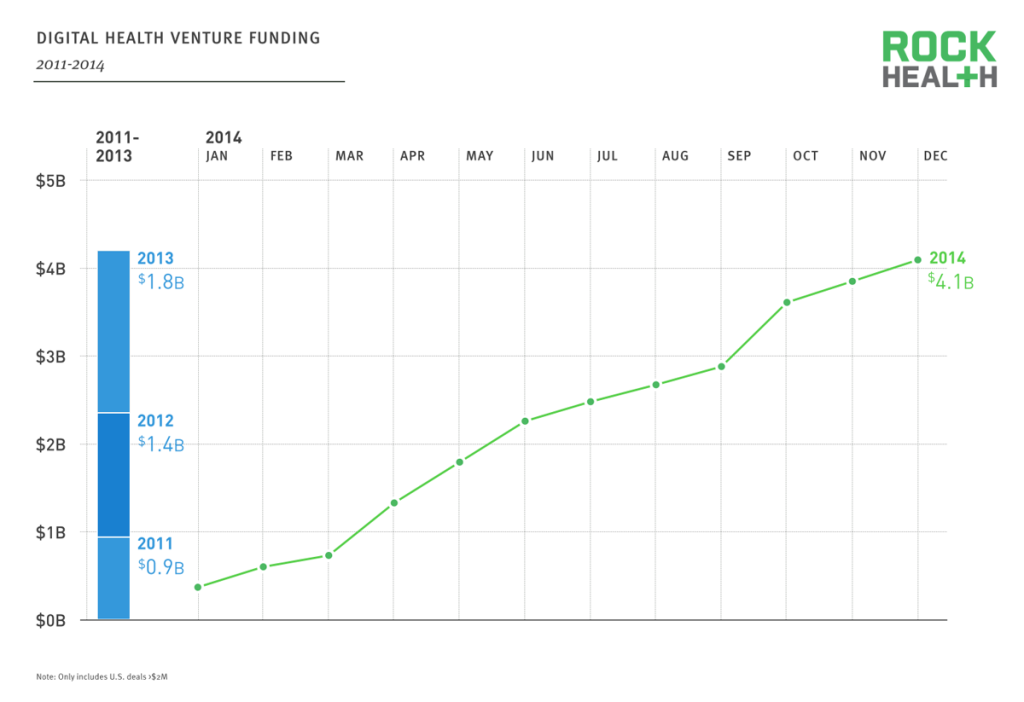
Venture funding of digital health companies surpassed $4B in 2014, nearly equivalent to the prior three years (2011-2013) combined.
Source: Rock Health Funding Database
With a fast start in January, venture funding for digital health companies was set to reach new heights. By the end of the second quarter. it had already surpassed the entire 2013 funding total.
Year-over-year growth in funding accelerated to 125% after slowing last year to 30%.
With this latest year, compound annual growth (CAGR) from 2011-2014 hit 45%. 2014 also produced the largest four individual quarters ever for digital health funding, with Q2 alone exceeding the entire 2012 total.
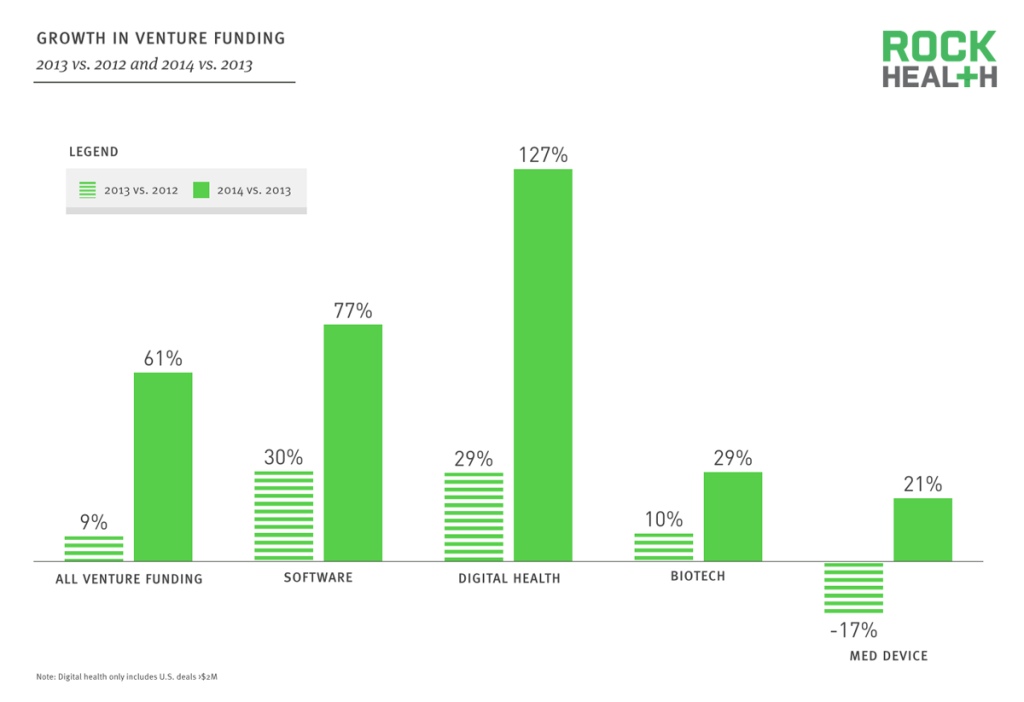
Digital health is the bellwether of venture funding, outgrowing both traditional healthcare and technology sectors.
Source: PwC MoneyTree; digital health data based on Rock Health analysis
There is no question that venture markets are hot, with overall funding exceeding $48B in a single year for the first time since the dot-com era.
Within that context, digital health funding has demonstrated differentiated growth, outpacing overall funding, the software sector, and traditional healthcare sectors—biotech and medical devices.
With this growth, digital health accounted for nearly 9% of all venture funding in 2014, a record that nearly triples its contribution to overall funding in 2011.
With the continued pressure on funding for medical device companies, digital health has for the first time overtaken medical devices in aggregate venture funding.
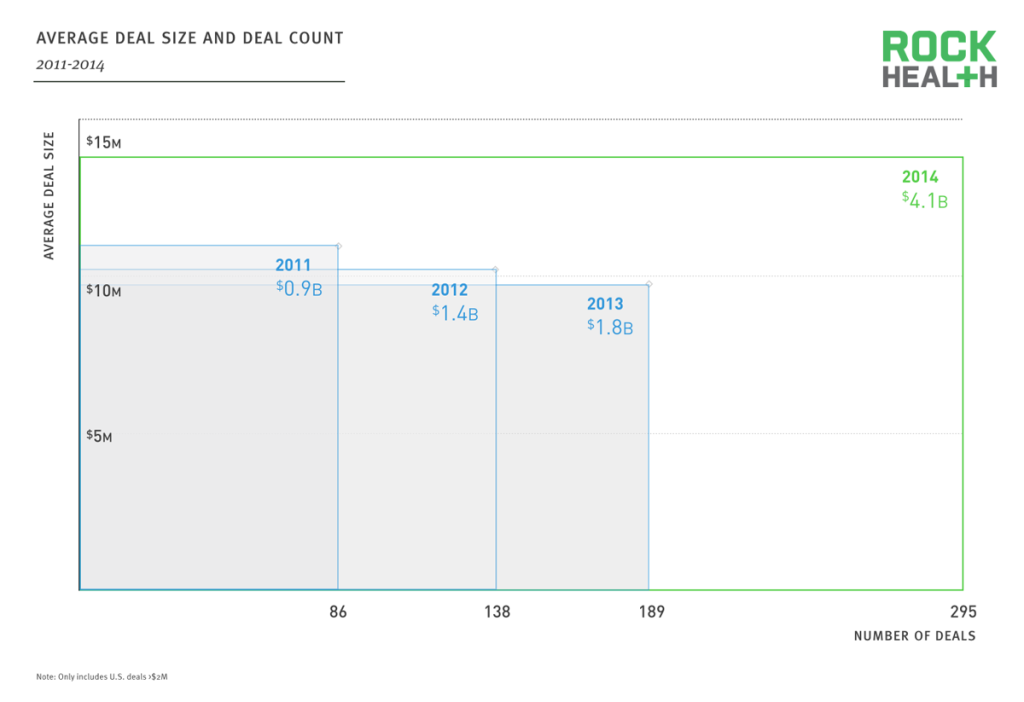
The average deal size and the total number of deals increased significantly in 2014, leading to a record-breaking year for digital health funding.
Source: Rock Health Funding Database
For the prior three years (2011-2013), average deal size has been steadily declining against significantly increasing deal count, falling under $10M in 2013.
2014 brought a sharp reversal to this trend, with average deal size up nearly 43% over 2013 to $14M. This increase in average deal size was combined with record deal growth of 56%, leading to to an overall record year for digital health funding.
The six largest rounds of the year total to more than $1B, representing nearly 25% of all 2014 funding.
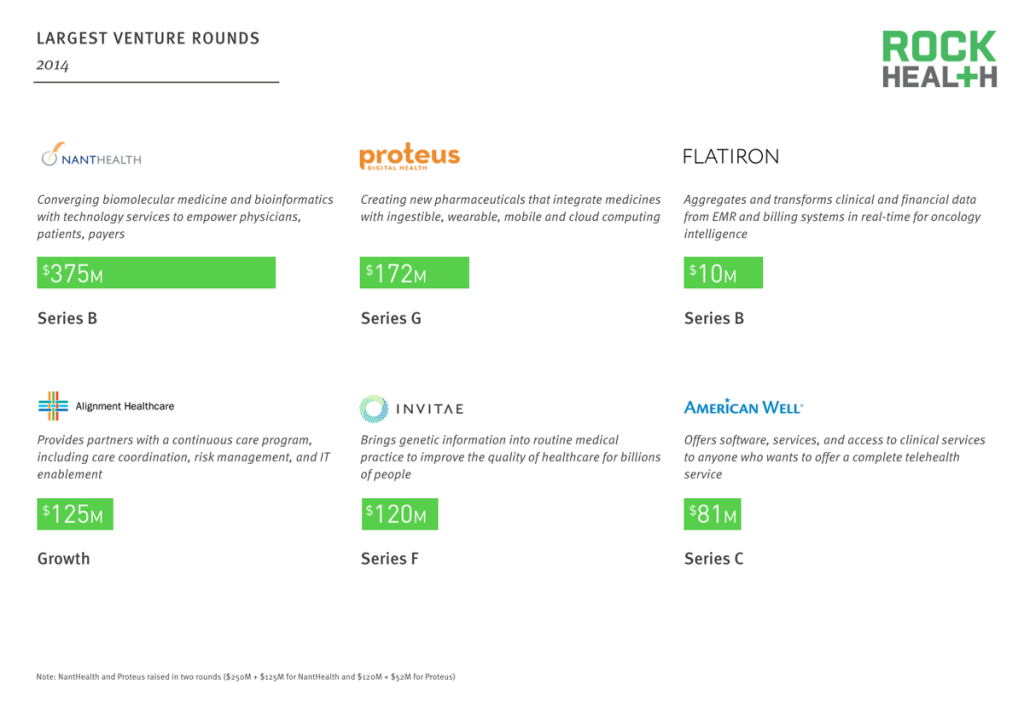
Source: Company websites
The largest deal of the year, funding NantHealth, was led by a sovereign wealth fund, the Kuwait Investment Authority.
Flatiron Health was the third largest and perhaps most remarkable deal of the year, raising $130M in a Series B (with an undisclosed amount going towards the acquisition of Altos Clinical, an oncology EHR provider).
Corporate investors were the most active type of investor in the largest deals.
Five of the top six categories of the year were influenced by these outsize venture deals (personalized medicine, population health management, digital medical devices, telemedicine, and analytics/big data).
The top six categories accounted for 44% of all digital health funding in 2014, with software-driven personalized medicine entering the rankings for the first time.

Source: Rock Health Funding Database
Three categories experienced breakout growth in 2014, suggesting transformational changes in the way healthcare will be defined, delivered, and administered.
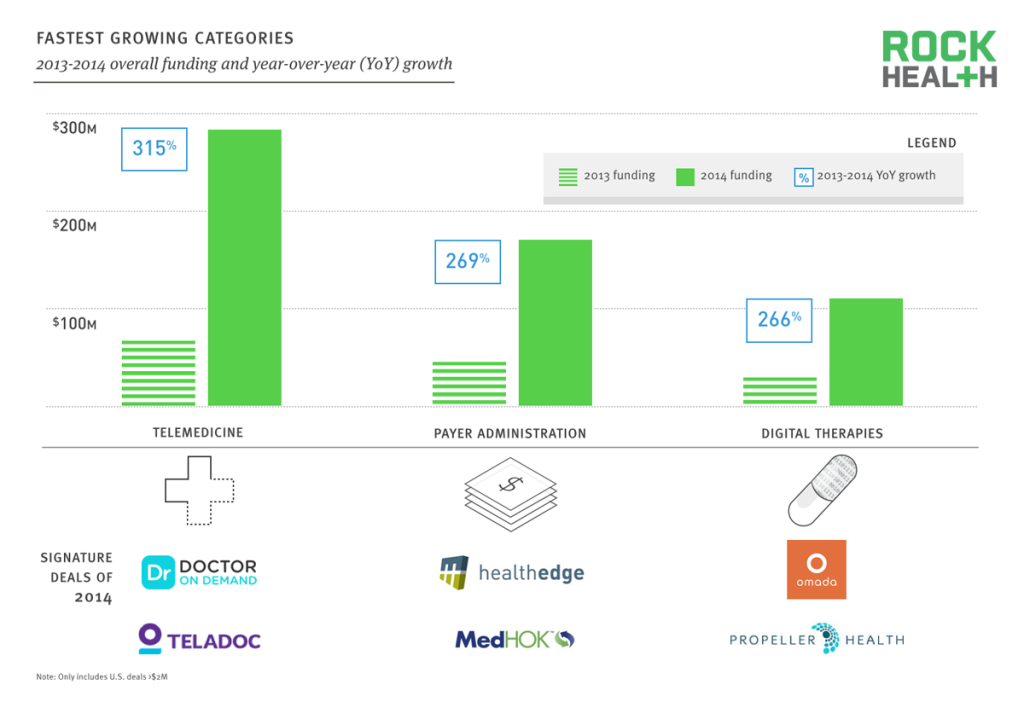
Source: Rock Health Funding Database
Telemedicine was the fastest growing category of 2014, fueled by mega deals in both established and new entrants. As both licensing and reimbursement turn favorably towards the sector, we expect telemedicine to be a mainstay of the top category list.
Health insurers continue to face significant administrative cost pressures, largely due to MLR caps and are investing in technology-enabled operational efficiencies, leading to rapid growth of companies in the payer administration space.
Finally, digital therapy companies that raised seed capital 2-3 years ago have demonstrated their effectiveness through initial studies—leading not only to commercial traction, but also significant fundraising. With more addressable diseases and more evidence, digital therapies are just getting started.
Digital health deal volume has tripled over the last three years, primarily driven by the growth of early deals in the Seed and Series A stages.
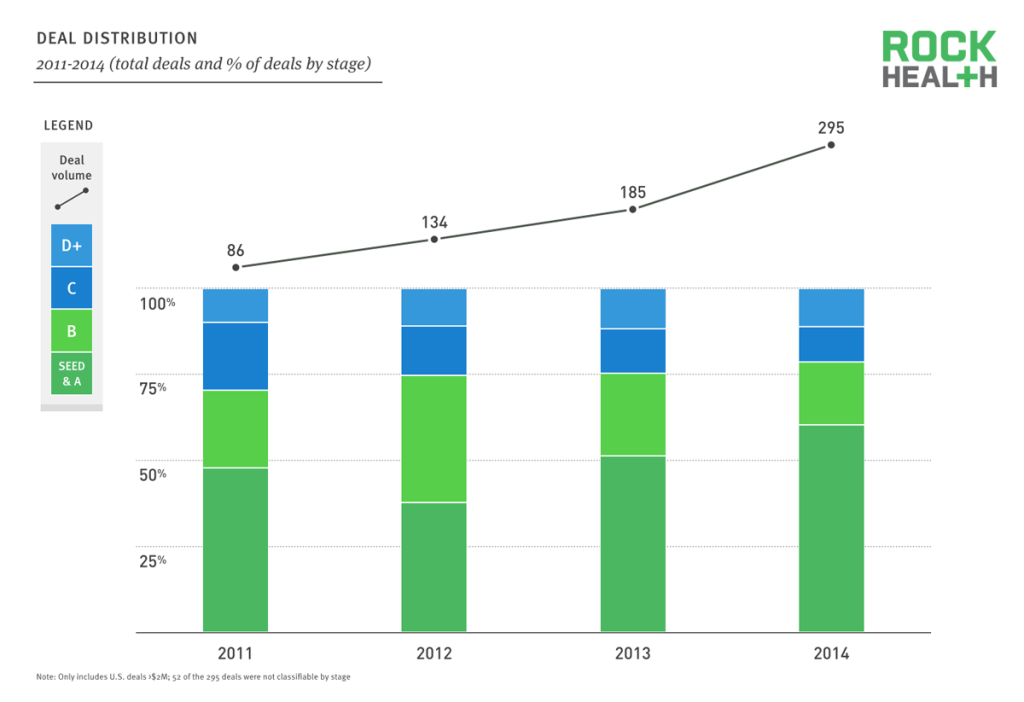
Source: Rock Health Funding Database
Excluding small deals (under $2M, representing less than $200M in annual activity) allows for a clearer picture of the growth in early stage companies, which dominate digital health funding and have been the primary driver of increased deal volume.
Multiple companies advanced through the funding funnel in 2014. Twelve companies progressed from Series A to B, five from B to C, one from C to D, two from D to beyond, and finally one company (Vivify Health), raised both a Series A and B in 2014 following its seed in early 2013.
At the early stage, round sizes have increased dramatically, with Series A and Series B up 38% and 61%, respectively.
Investors
While the number of investors dabbling in digital health continues to climb, serial investors are growing even faster, with 35 firms doing three or more deals apiece in 2014.
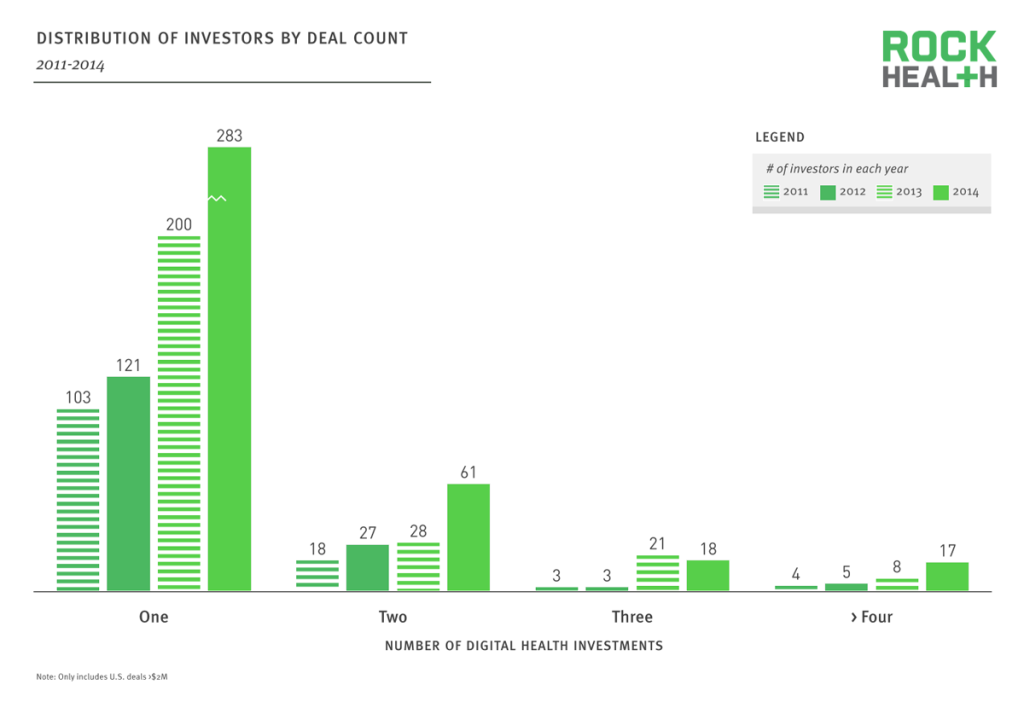
Source: Rock Health Funding Database
Each year since 2011, the number of investors entering the digital health space has climbed. Funds doing only a single digital health deal in a year (the “dabblers”) have nearly tripled over that time period, while those who do three or more deals (“serial” investors) has grown by five times over the same period.
Serial investors tend to stick, with slightly more than half of those from 2013 doing 3+ deals in 2014 as well. On the other side, dabblers show moderate persistence, with 35% of the 2013 group doing at least one deal in 2014 as well.
New digital health investors drive the increase in dabblers, with 216 of the 2014 group appearing for the first time in our database.
The most active investors in digital health represent a broad cross section of corporate, healthcare, technology, and sector-agnostic venture funds.
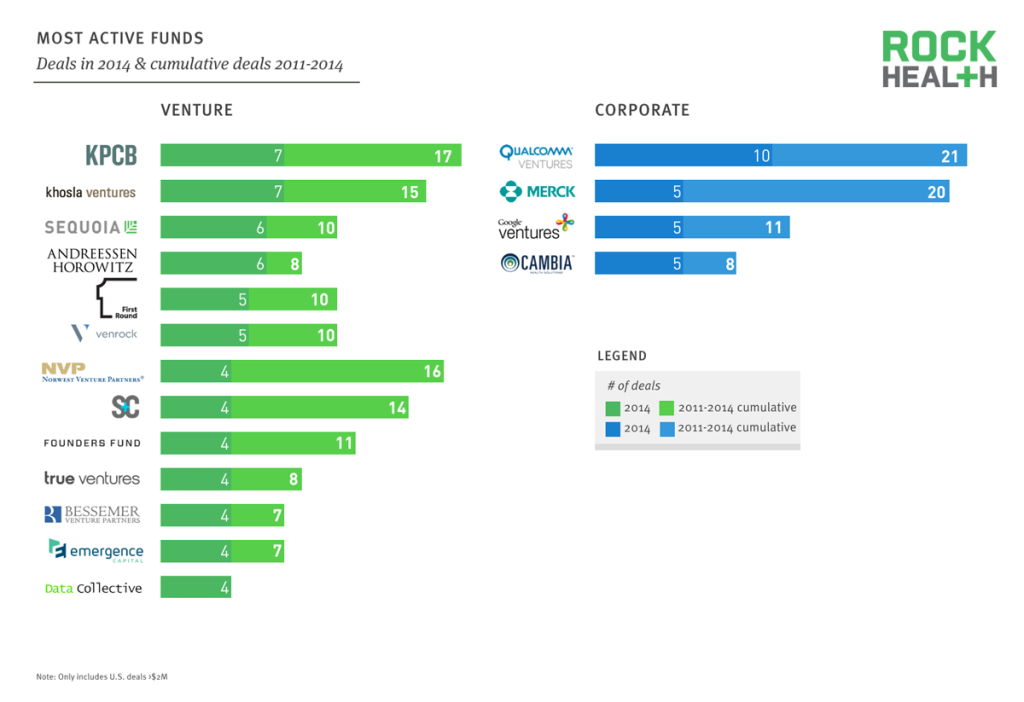
Source: Rock Health Funding Database
The top of the most active investor list has remained remarkably stable over the 2011-2014 time period, with both KPCB and Qualcomm amongst the most active funds each year.
Thirty-nine separate funds did at least six deals over the 2011-2014 period, representing a nearly equal mix of healthcare-focused, tech-focused, sector-agnostic, and corporate venture funds.
Digital health has benefited from having a diverse base of investors with widely varying investment theses, with many of the most active firms not having done any co-investments.
Geographies
Digital health companies from over 30 states received funding in 2014, with Bay Area-based companies accounting for 25% of all 2014 funding.
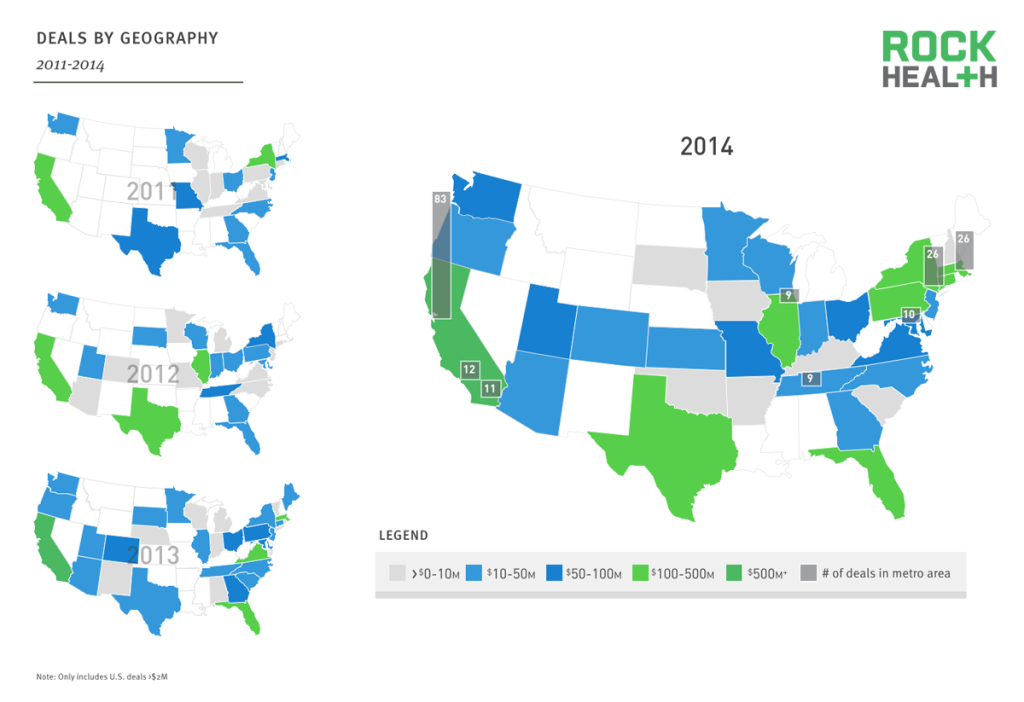
Source: Rock Health Funding Database
In 2014, California-based companies raised $1.8B, nearly as much as total funding in all of 2013.
Boston and New York metro areas experienced rapid growth in dollars raised since 2011 (303% and 136%, respectively).
Over the past four years, the top three states that saw the most growth in deal volume were Illinois, Pennsylvania, and Tennessee.
Alternative Funding
Although the total number of campaigns on crowdfunding platforms has increased by over 60%, successful campaigns and total dollars raised are in decline.
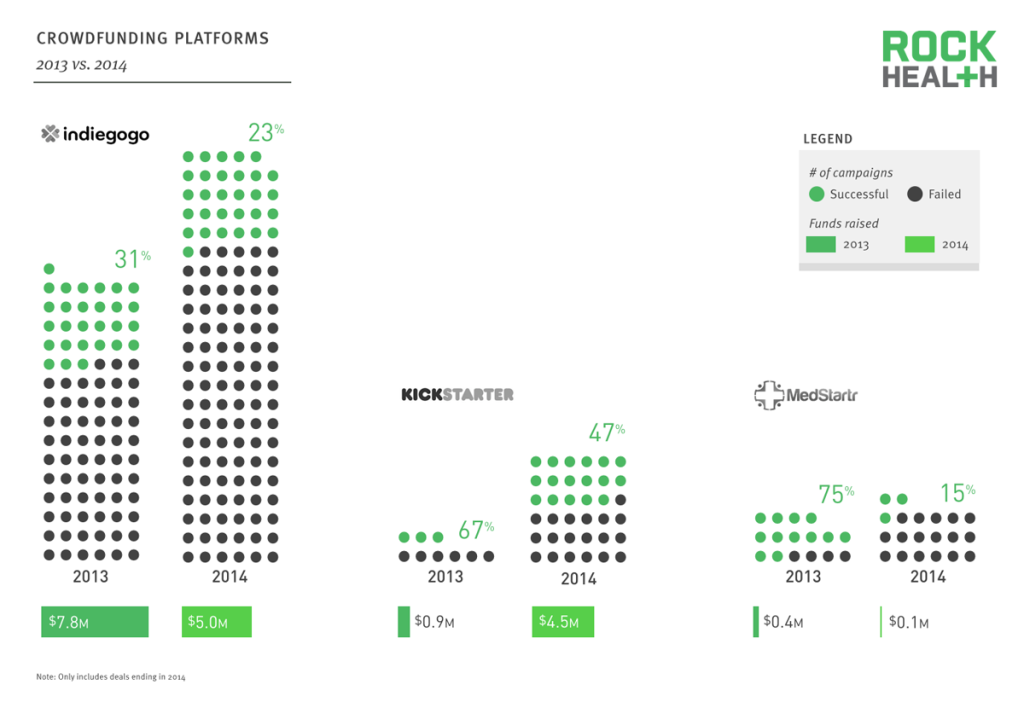
Source: Indiegogo, Kickstarter, MedStartr
Across all three major crowdfunding platforms, a total of 187 campaigns were tracked in 2014.
Despite the growth in number of campaigns, success rates have declined across all platforms.
In June, Kickstarter changed its policies to lower barriers for health and medical product campaigns.
Since then, 33 campaigns have closed with half of those ending successfully. One campaign alone accounted for 53% of total dollars raised on Kickstarter (Hello’s Sense).
Exits and Public Markets
We tracked 95 M&A deals throughout 2014, representing over $20B in disclosed transactions.
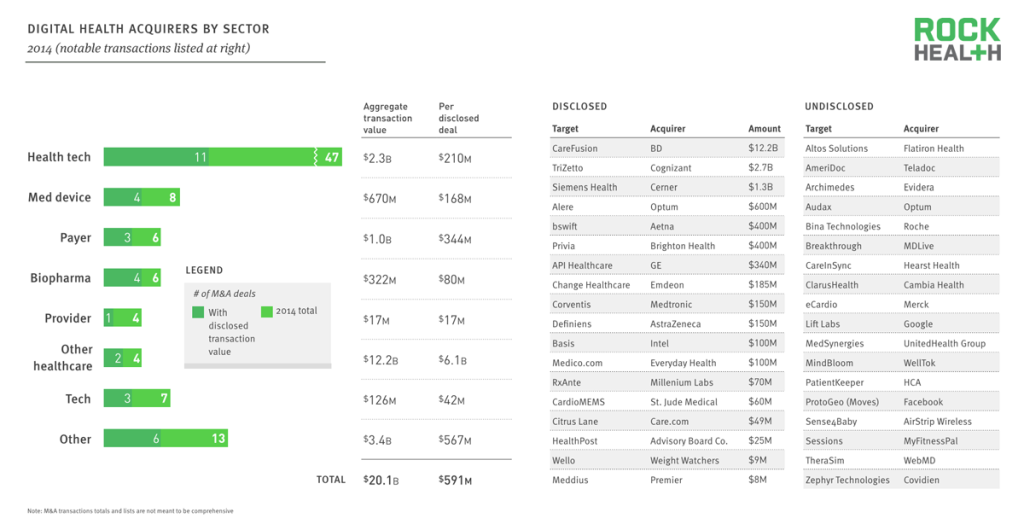
Source: Rock Health tracking and analysis based on news reports
Throughout 2014, 95 M&A deals were tracked, with disclosed transactions valuing over $20B. Large health tech companies continued to be the most active acquirers—but medical device, payers, and tech companies are making moves too. These industry players understand that the convergence of healthcare and technology will shape their business models and competitive landscape.
Five digital health companies went public in 2014, all of which are currently trading below their highs.
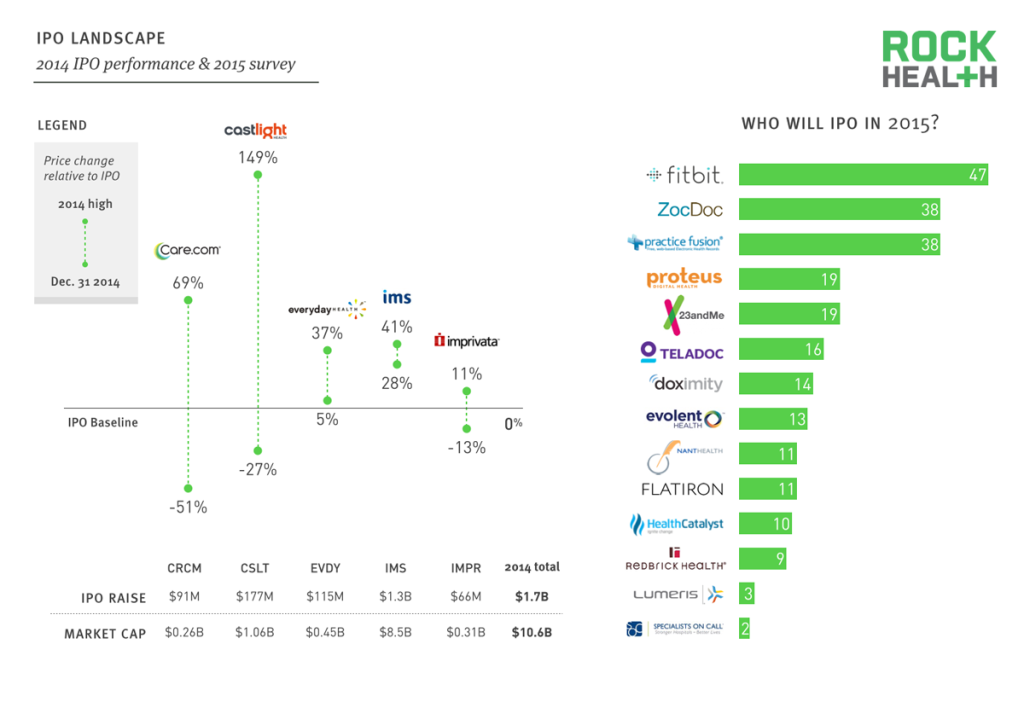
Source: 2014 performance from NASDAQ and Google Finance as of market close on December 31, 2014. 2015 IPO outlook based on Rock Health survey of Rock Weekly readers (n = 100; 60% entrepreneurs and investors)
Three out of the five companies are down from their debut, with Castlight Health experiencing the largest sell-off, losing nearly 75% of its peak value.
IMS Health—a company making its second IPO after being taken private in 2010—is showing the biggest gain since its offering.
Without any offerings in the second half of 2014, digital health has pent up demand for exits in 2015, with our readers identifying the largest names in the space as most likely to IPO.
Publicly-traded digital health companies did not fare well in a year when the public markets demonstrated strong overall performance.
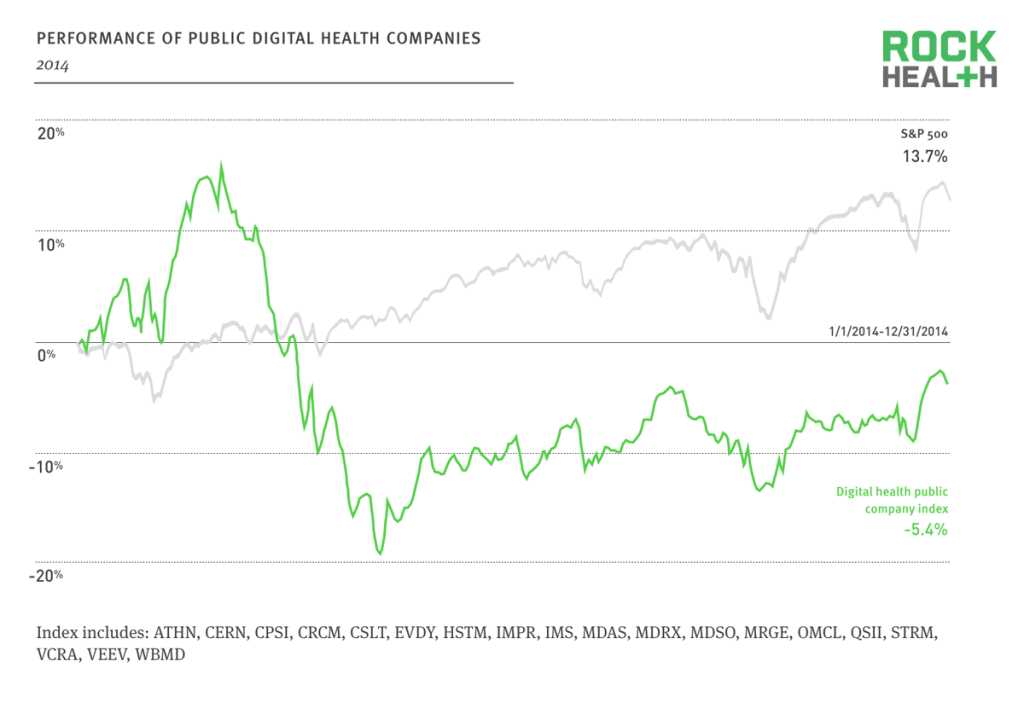
Source: The Digital Health Public Company Index by Rock Health (as of market close on December 31, 2014)
The digital health public company index, comprised of 19 companies and now exceeding $53B in aggregate value (BenefitFocus was removed due to its broadening focus on general HR software) launched earlier this year.
Summary of findings
Funding and deal volume: Venture funding for digital health companies in 2014 surpassed $4.1B, nearly equivalent to all three prior years (2011-2013) combined. This represents more than 125% YoY growth in funding compared to 2013. 293 deals, across 258 companies, closed with an average deal size of $14.1M.
Major themes: The top six themes of the year that received 44% of all funding included: analytics and big data, healthcare consumer engagement, digital medical devices, telemedicine, personalized medicine, and population health management. Personalized medicine joined the top six for the very first time this year.
Growth categories: Three categories received significant growth in funding: telemedicine, payer administration, and digital therapies. Telemedicine and digital therapies are new ways of delivering care that can help improve care and reduce costs. As healthcare reform uncertainty and changes persist, payer administration tools will be essential for efficiently and effectively navigating the healthcare industry.
Prolific investors: In 2014 alone, 379 distinct investors funded digital health companies, 35 of which made 3+ deals (the serial investors) and 216 of which were investing in digital health for the first time since we began tracking in 2011. The most active digital health investors have remained stable—and diverse—over the past four years.
Exit activity: 2014 saw a lot of exits. There were 95 M&A transactions tracked and disclosed deals were valued at over $20B. Health tech companies were still the most active acquirers. Beyond private exits, the public markets welcomed five digital health companies with a total current market capitalization of $10.6B.
Methodologies
What is digital health?
Rock Health defines digital health as the intersection of healthcare and technology. This means that the venture funding tracked only includes technology-enabled health-related companies, whether they focus on the administration of healthcare, the delivery of healthcare, or the process of bringing breakthrough new healthcare products to market (both R&D and commercialization).
Healthcare companies that aren’t digital. Health insurance companies, such as Oscar, or healthcare providers, such as One Medical, are pure services companies (that employ technology, certainly, as does every company). This is in direct contrast to a technology-enabled services business such as telemedicine, that simply could not exist without digital. Molecular diagnostic companies, such as Guardant Health, that perform testing and render a definitive diagnosis to physicians are also excluded. Similar to biopharma companies, molecular diagnostic companies are significantly more capital intensive than software-based companies and would skew funding.
Technology companies that aren’t healthcare. Companies diversified across industries are not included. Software companies focused across human resources (and not solely health benefits), such as Zenefits, are not included.
How we track digital health funding
Rock Health funding data only includes disclosed US deals over $2M. Deals under $2M would be impossible to track comprehensively since companies often do not file their small seed rounds with the SEC or disclose to press. We also believe that deals under $2M generate noise in key statistics, including deal count and average deal size. Disclosed deals under $2M represent less than 5% of the total we report, giving us confidence in our overall figures.
In prior years, we have attempted to include international companies that were funded by U.S. investors, monitoring the portfolios of hundreds of VCs. In reviewing this data, we have concluded that it is challenging to track all international deals and beginning with this 2014 year end report, we are no longer tracking or reporting any international deals. All numbers in this report are for U.S.-based companies only.
Funding tracked includes debt, venture rounds, and growth equity but excludes lines of credit (working capital) and cash/equity associated with merger or acquisition activities.
Deals data is gathered based on publicly available resources (press releases, news outlets, SEC filings, etc.) and supplemented with CapIQ’s venture data.