


Healthcare consumers in a digital transition
At Rock Health, we believe the purpose of healthcare innovation is to deliver value to patients. For those entrepreneurs and business leaders seeking to transform an individual’s health and care experience via tech-based tools, a deep understanding of consumer preferences is a must. That’s why every year1 we deploy a 4K-person survey of the US adult population to shed light on how consumers are engaging with technology-driven healthcare innovation. 2017 was the third year we deployed this survey, giving us three-year trend data for the first time.
Before getting deep into the data cuts, we outline five value drivers for digital health innovators to employ to create consumer engagement. Innovators must deliver on one or more of these consumer-centric value drivers to ensure adoption and succeed in the digital health market.
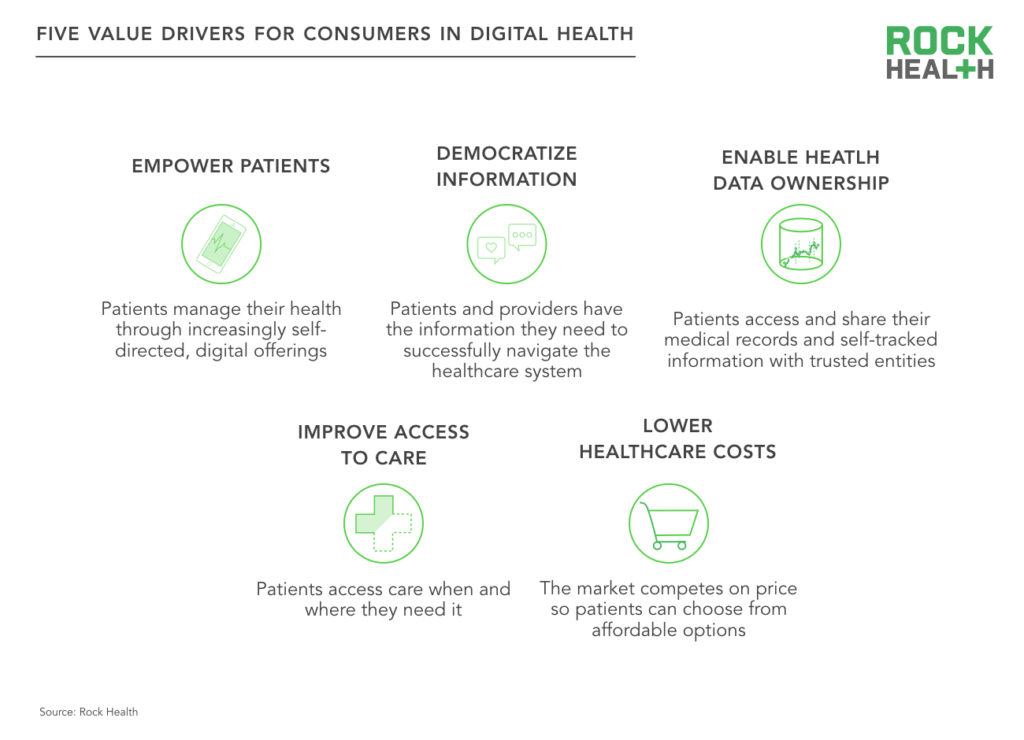
Read on for eight insights from the 2017 survey data. For access to all of the insights in the full report, become a Rock Health partner. Email partnerships@rockhealth.com for more information!
1. Consumers are in transition
With data from 2015-2017, we see a clear upward trend of consumers taking control of their healthcare via the use of digital tools like telemedicine, wearables, and online provider reviews. The percentage of respondents adopting at least one digital health tool increased from 80% in 2015 to 87% in 2017.
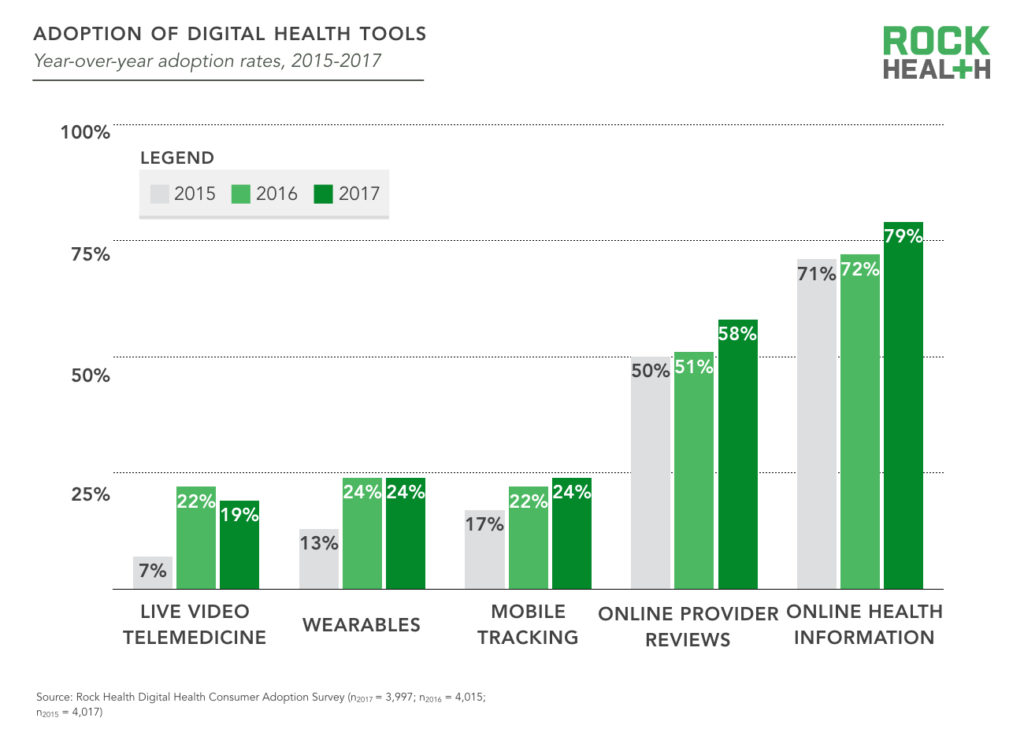
But the needle has not moved equally across every subgroup of the population—nor across every type of digital health solution. The data tell us that some subgroups prefer traditional healthcare channels; that patient demographics influence readiness to pay out of pocket for expanded services; and that those with chronic conditions (often with the greatest potential to benefit from digital health) are selective in their uptake of digital health. So while digital health solutions promise impactful, even life-altering outcomes for patients, consumers are still transitioning to testing out—and sustainably integrating—these solutions into their lives.
2. Respondents using digital health tools are satisfied with the experience—though winning innovators will create sustained engagement, drive behavior change, or both
Whether using wearables, digital health tracking apps, or telemedicine, survey respondents reported that they got what they were hoping for from the experience. For instance, even though respondents prefer in-person doctor visits to telemedicine, those who have used live video telemedicine are satisfied with it—particularly if they paid out of pocket. Sixty-nine percent of those who paid out of pocket indicated they were “extremely satisfied” versus 30% for those who did not pay out of pocket.2
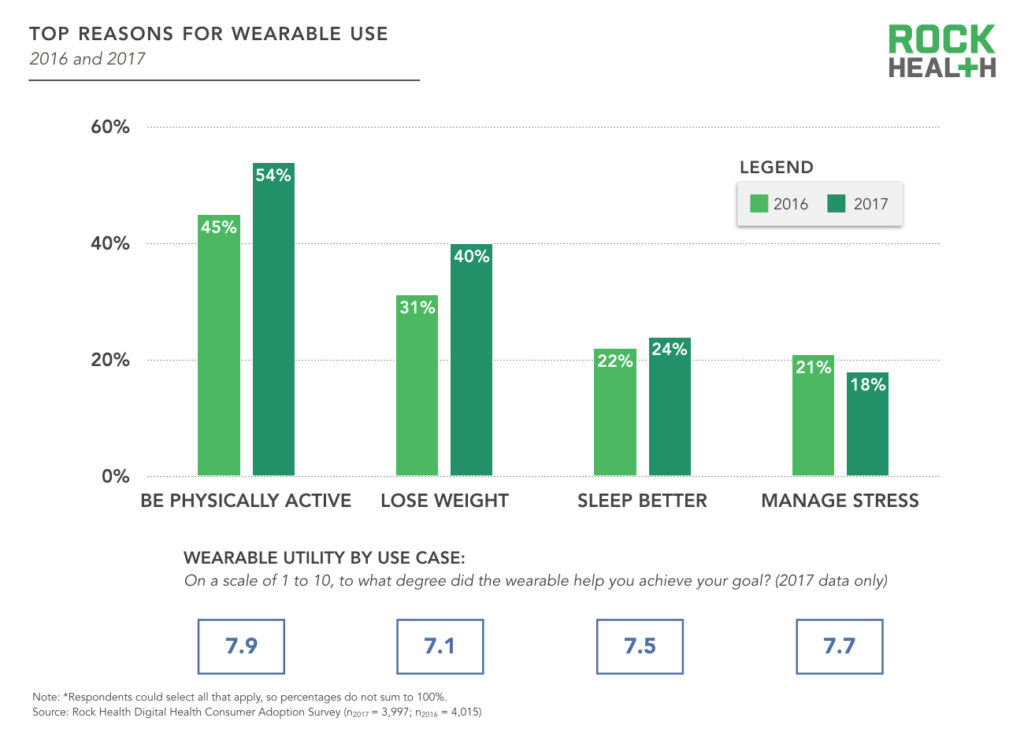
Respondents who tracked various health goals—for example, weight, physical activity, sleep, medication adherence—via digital apps and wearables reported making progress on or otherwise achieving their health goals3. While encouraging, innovators still have much to do to ensure sustained engagement that helps consumers achieve meaningful health outcomes.
3. Those with a self-reported health condition are more likely to track health goals—though most do not use digital apps to do so
Those experiencing health challenges actively track their health, but digital solutions don’t consistently reach these high-need populations. For instance, respondents taking medication and those with high blood pressure are likelier than not to track a related health goal; but a minority of these groups use a digital solution to do so. Of those respondents tracking their blood pressure, only 11% do so with a digital app/journal.
However, respondents who self-identified as obese and who track diet or physical activity buck this trend. This subgroup has adopted digital tracking systems at a somewhat higher rate compared to the average for all respondents.
4. Discontinued use threatens the lasting utility of wearables. Innovators must offer sustained value to customers or face the fate of other expendable gadgets
Among the 24% of respondents (974) that own a wearable device or smart watch, over a quarter (260) reported that they no longer use the wearable.
Interestingly, the top two reasons for discontinued wearable use are contradictory: nearly 30% of users discontinued use after achieving their intended goal, while 20% stopped use because the wearable was ineffective in helping them achieve their goal.
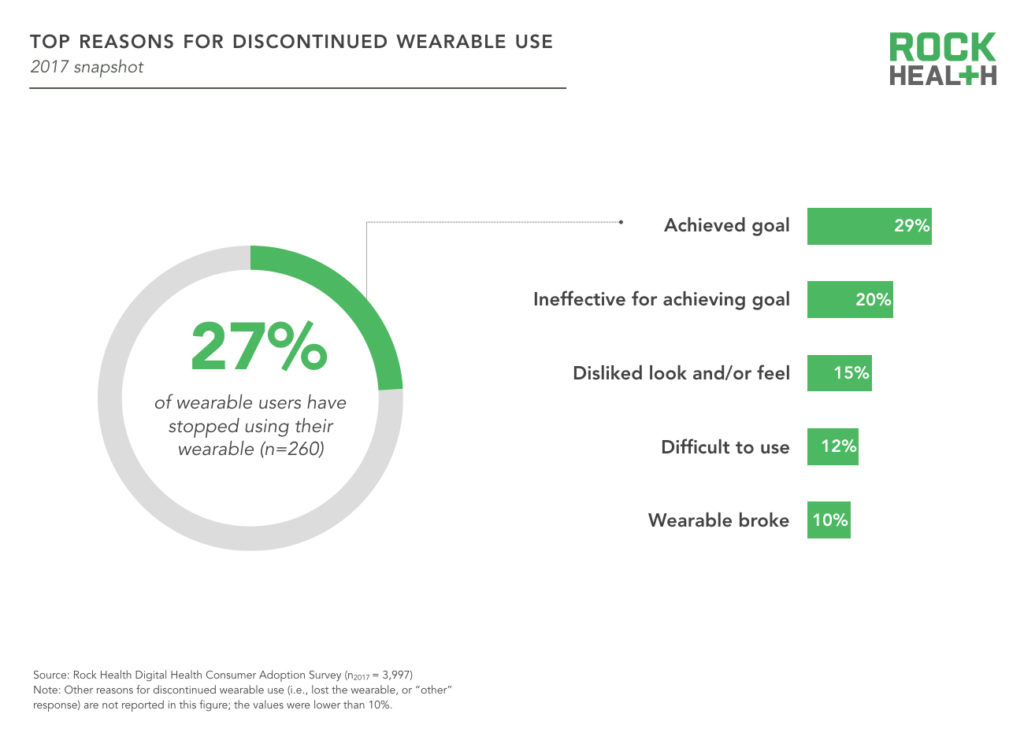
Achieving a goal represents success from the consumer’s vantage point, but not necessarily from a business standpoint. Companies must figure out how to deliver long-term value to ensure sustainable customer engagement, even if users hit health goals along the way.
Additionally, sorting out usability challenges is critical. One AARP study found that while digital trackers increased older users’ motivation for healthier living, many participants discontinued use before the end of the six-week study because of perceived data inaccuracies, challenges with instruction, device malfunctions, and discomfort.
5. Well over half of respondents search online for reviews, and a significant minority act on those reviews
Fifty-eight percent of respondents have, at some point in their lifetime, searched for an online review of a provider. This is an increase from 50% in 2015, with the boost largely coming from increases in searches for pharmacies and hospitals.
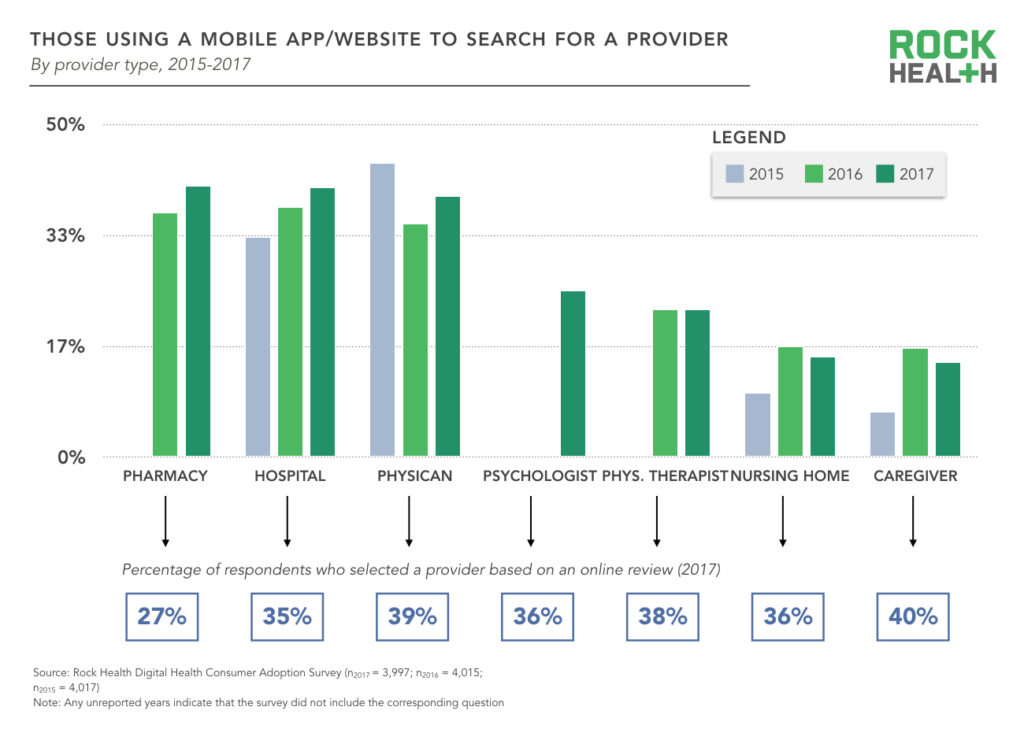
A significant group of respondents (ranging from 27% to 40%) report taking action based on provider online reviews. Though this survey does not explore what information ultimately drives consumers to act (or not), one possibility for why many respondents don’t take action is that even with more information online, consumer choice is likely constrained by other factors (e.g., insurance, geography).
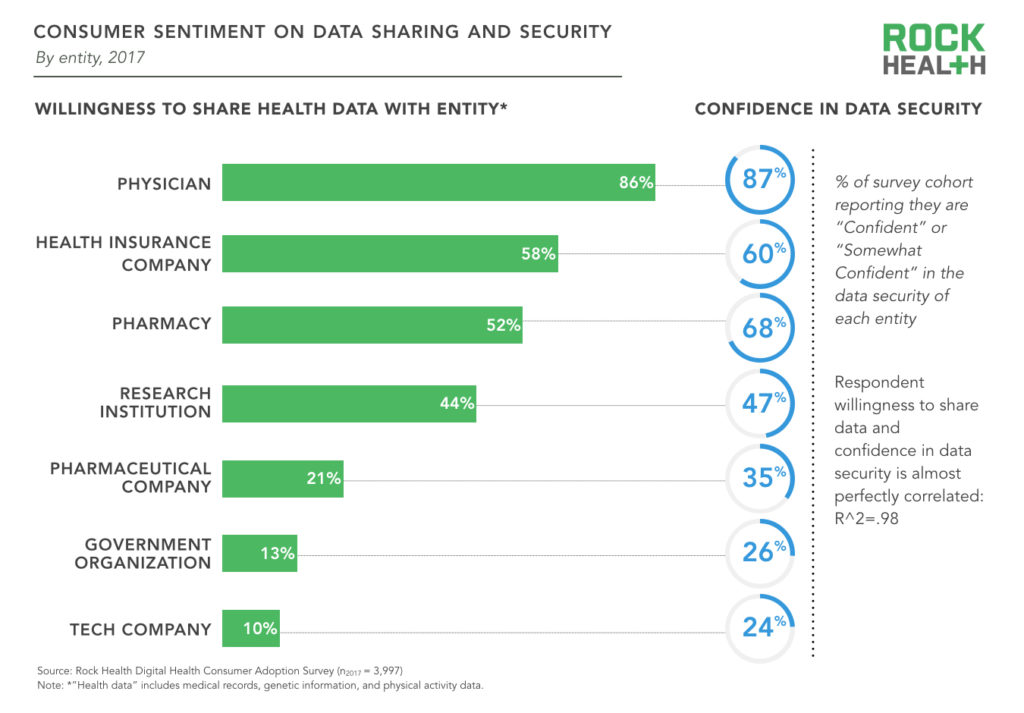
6. Respondent willingness to share health data with an entity is correlated with confidence in that entity’s data security
Though most respondents are willing to share health data with their physician, there is a significant drop-off in willingness to share with other stakeholders. 58% are willing to share with health insurance companies and 52% with pharmacies. Though sharing data with multiple entities is inevitable (because sharing information with a physician nearly guarantees, for example, that it will be shared with a payer or pharmacy), the degree of trust respondents have varies across these groups.
Data security matters: Respondents’ willingness to share health data with an entity is nearly perfectly correlated with respondents’ confidence in the data security of that entity. Of note, respondent confidence in data security of tech companies declined from 31% in 2016 to 24% in 2017 (and may decline further if press about major data breaches continues).
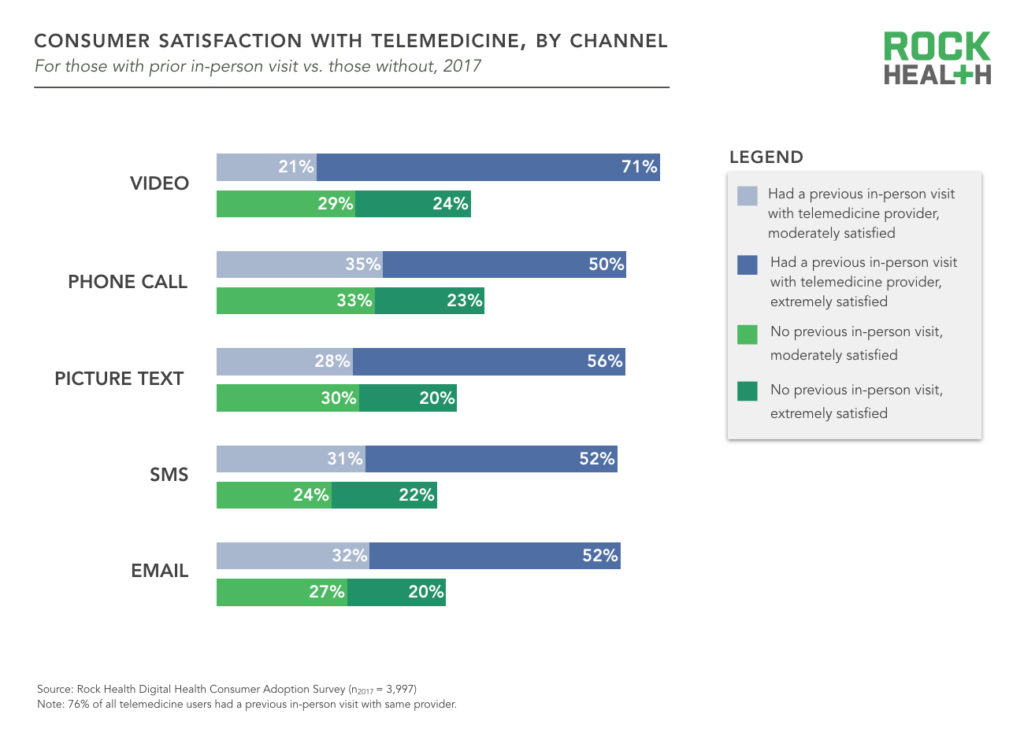
7. Relationships matter—having an in-person visit followed by a telemedicine visit with the same provider led to higher satisfaction with the video visit
Respondents who had a prior, in-person visit followed by a telemedicine interaction were significantly more likely to be satisfied with their telemedicine visit. For instance, 92% of respondents with a prior in-person visit were satisfied4 with their video visit compared to 53% satisfaction among those without a prior in-person visit.
This finding holds true across all channels of telemedicine (outlined in the graphic), signaling several opportunities. First, providers have a tremendous opportunity to provide continuous care—and offer a great patient experience—through telemedicine. Second, these data support strategies that employ telemedicine to establish a more robust, long-term relationship with patients. Third, companies establishing their own provider network to serve new patient populations (as opposed to offering telemedicine services for providers to serve existing patients) may wish to consider ways to build relationship capital in order to provide a great experience.
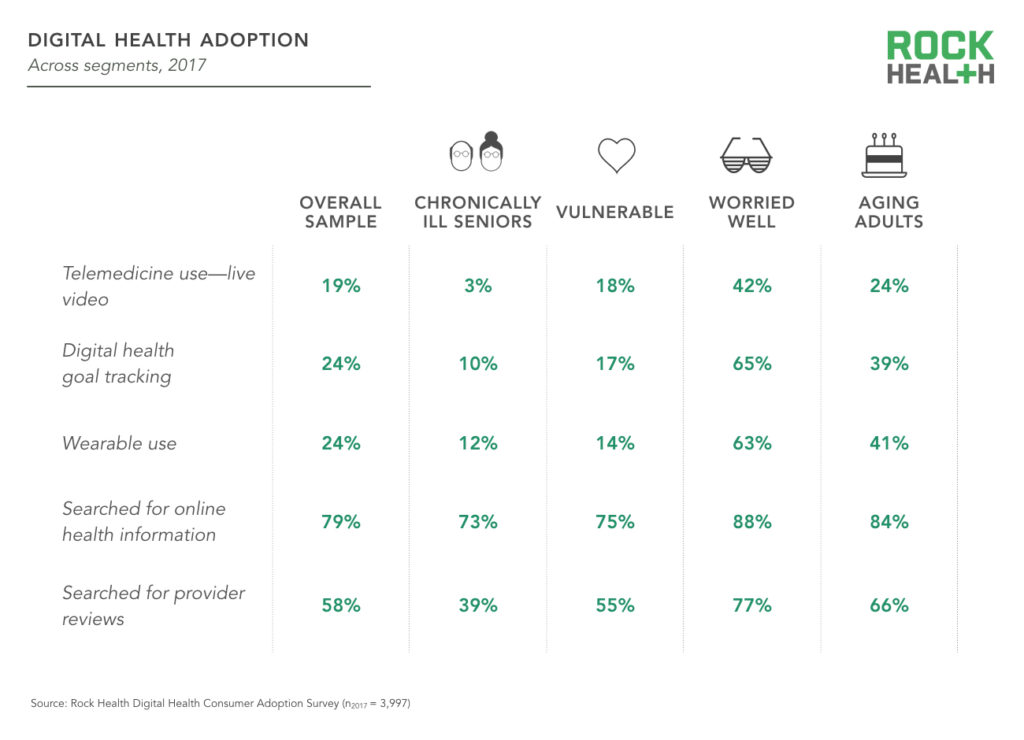
8. Chronically ill seniors represent the greatest opportunity to improve health—though they are the least likely to use digital health tools
To highlight demographic hotspots and trends, we’ve developed four consumer segments.
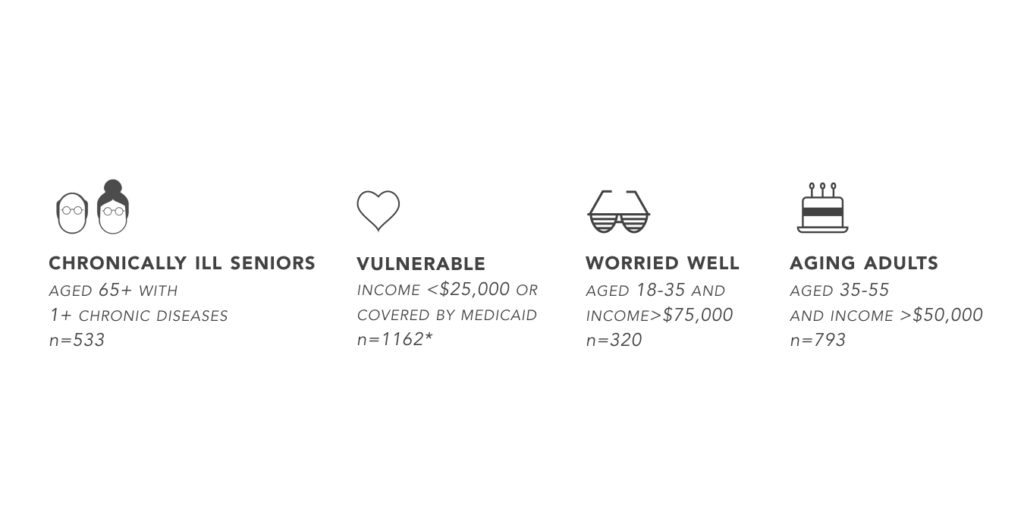
Here are just a few of the insights we’ve uncovered:
- Digital health adoption is significantly higher among young, high-income adults compared to other consumer segments.
- While aging adults have the second highest adoption of digital health technologies, the worried well segment is more likely to use digital tracking tools and wearables by a margin of more than 20 percentage points.
- Not surprisingly, chronically ill seniors have the greatest demand for healthcare services—86% visited a doctor at least twice in the past year and 97% are managing at least one prescription. Yet they are the least likely to leverage digital health technologies, with extremely low rates of live video telemedicine use, digital health goal tracking, and wearable use.
We’re excited to continue tracking trends in consumer attitudes and adoption of digital health services. If you’d like to learn more about this survey—and access the full data set—become a Rock Health partner! Please email partnerships@rockhealth.com to learn more. We also encourage academics and startups to connect with us to access our research. For more information, please email research@rockhealth.com.
1We’ll be deploying our 2018 survey soon!
222% of live video telemedicine users who paid out of pocket were “moderately satisfied” and 32% of those who did not pay out of pocket for live video telemedicine were “moderately satisfied.”
3Respondents were asked to rate on a scale of 1 to 10 the degree to which specific digital health tools helped them make progress on their health goal. Respondents rated the helpfulness of digital health tracking between 7.7 and 8.2 across the various health goals included in the survey. These results held (ranging between 7.1 and 7.9) when respondents were asked about the degree to which wearables helped them achieve specific goals.
4Here we consider a respondent “satisfied” if they reported being “moderately” or “extremely” satisfied with their telemedicine visit.