


The new era of consumer engagement: Insights from Rock Health’s ninth annual Consumer Adoption Survey
Across 2020-2021, we watched as virtual care soared from a niche offering to a pandemic-catalyzed must-have. Like investment patterns, consumer adoption and preferences surrounding digital tools have evolved since the pandemic—putting us in a new reality of consumer expectations. Virtual care has become table-stakes and is here to stay for patients and providers. However, that ubiquity comes with its own set of market pressures: competitive (what defines the best virtual care), replacement (virtual care doesn’t have a monopoly on convenience, access, or affordability), and of course, regulatory and reimbursement pressures. Virtual care is shifting from pandemic-responsiveness to market- and consumer- responsiveness.
In this piece, we explore how consumers are adjusting to this new era of virtual care by sharing data and insights from Rock Health’s 2023 Consumer Adoption of Digital Health Survey (hereto referred to as the “Survey”). In this Survey, we asked a cohort of over 8,000 U.S. Census-matched adults about their behaviors and attitudes toward virtual care and digital health tools.1
According to 2023 Survey results, overall digital health adoption has steadied over the past several years and recent utilization is high among virtual-care users. Consumers familiar with digital health options are also becoming more selective about how they engage with virtual care, as indicated by changes in preferences for virtual care by care need and greater reluctance to share health data. Below, we share four insights on how consumers’ relationship with virtual care has changed and may continue to change in this new phase. We’ll also offer our take on how digital health leaders can navigate this environment and prepare for success.
- Virtual care is now a ubiquitous part of the modern healthcare paradigm
- Consumers are drawn to virtual care’s convenience, but innovators will need to invest in additional value drivers to stay competitive
- Consumers are familiar with at-home COVID-19 diagnostic testing, but adoption hasn’t yet translated to other test types
- Though consumers are willing to share their health data, they’re becoming more discriminating about whom they’re willing to share data with
Virtual care is now a ubiquitous part of the modern healthcare paradigm
In 2023, 76% of Survey respondents reported having ever used virtual care (care delivered via video, phone, text, or app), the third consecutive year that virtual care adoption was reported at or near 75 percent.2 Eighty-three percent of the respondents who have used virtual care reported using virtual care within the last 12 months. Steadied overall adoption and high rates of recent usage signal that the U.S. virtual care market has reached a maturity point.
It’s important to acknowledge that, even in a mature virtual care market, a proportion of consumers will not participate: 24% of Survey respondents reported never having used virtual care. Of those non-user respondents, most simply prefer in-person care to virtual care (56%). Others cited concerns about quality (18%) and lack of awareness (13%), or barriers like cost (5%) and poor internet service (3%).
Some of these non-users may eventually adopt virtual care if their preferences change, barriers are removed, or if another factor (e.g., insurance coverage) pushes them toward virtual care. However, even if these changes occur, we don’t ever expect virtual care adoption to reach 100%. A spectrum of omnichannel offerings—traditional, virtual, and retail—will always be needed to meet all consumers’ preferences and circumstances. The important takeaway is that, for most consumers, virtual care is now a fixed expectation on that spectrum.
But even virtual adopters sometimes prefer in-person care for certain health needs, further building the case for a spectrum of omnichannel approaches.
Consumers are drawn to virtual care’s convenience, but innovators will need to invest in additional value drivers to stay competitive
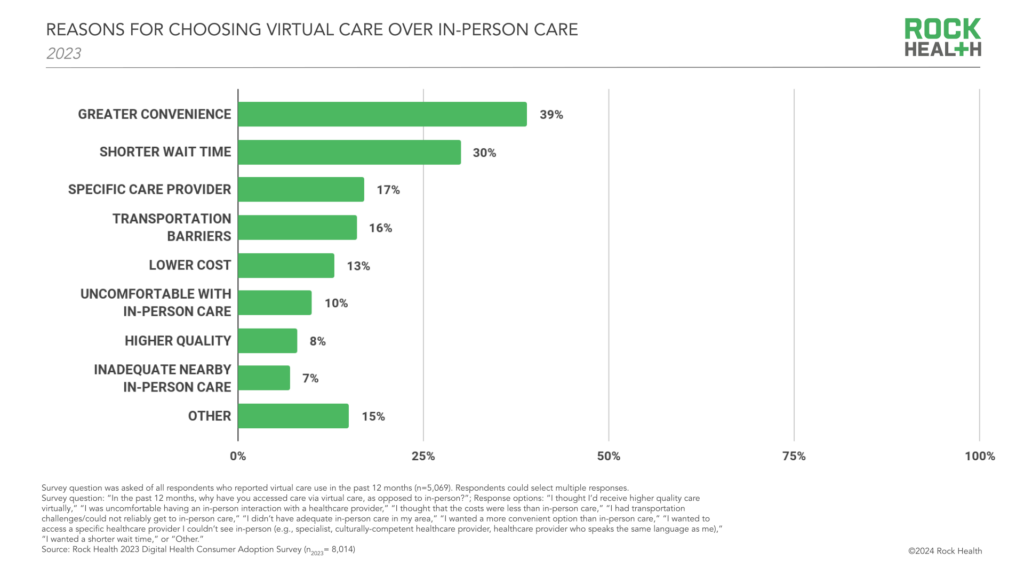
Survey respondents who reported using virtual care recently (i.e., within the past 12 months) chose virtual options over in-person care for greater convenience (39%), shorter wait times (30%), and the ability to see a specific provider who couldn’t otherwise be seen in person (17%).
Our Survey also asked respondents whether they prefer virtual or in-person care for specific care needs. For the second year in a row, the highest proportion of respondents preferred virtual care over in-person care for prescription refills, followed by minor illness care, then mental health—care needs that benefit from factors like shorter wait times and provider selection, mentioned above.
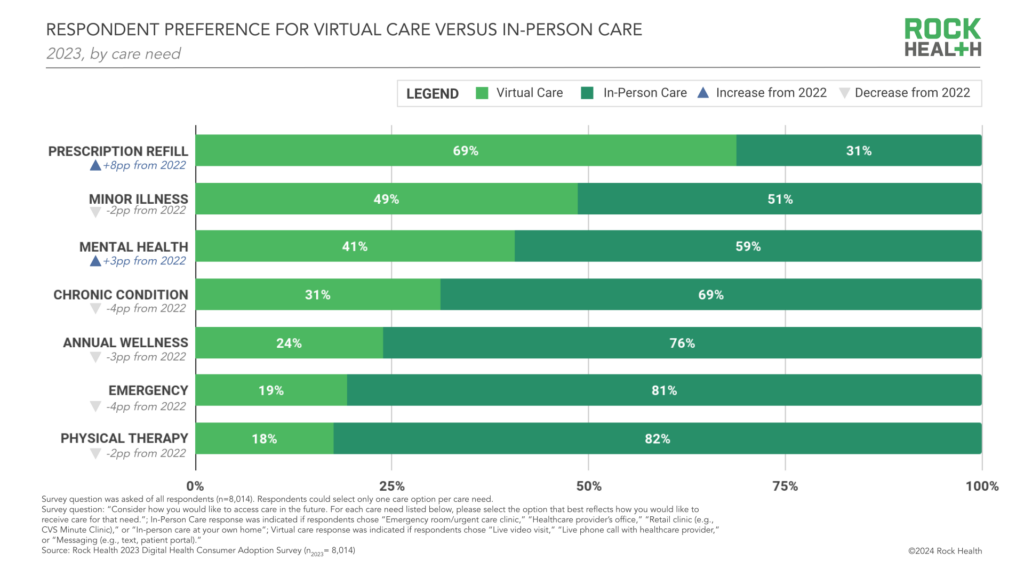
Compared to 2022, the proportion of respondents that prefer virtual care to in-person care increased for prescription refills (69%, 8pp increase) and mental health services (41%, 3pp increase). It’s not surprising that consumers have grown to prefer virtual for these two care needs. Prescription refills are transactional care encounters, making them well-suited to low-touch virtual channels like in-app or in-portal messaging. For mental health, the shift to virtual care reflects a changing status quo. Mental health tops the list of care specialty visits conducted virtually and many consumers now consider it more “typical” to see a mental health provider virtually than in person. Digital platforms for mental health can empower consumers to choose from a wider range of providers with different identities, affirming practices, or treatment approaches—qualities of care that are especially relevant to mental health. Not to mention, virtual channels could feel more convenient for consumers with regular (e.g., weekly, bi-weekly) mental health care appointments.
However, for other care needs, a smaller proportion of respondents preferred virtual care in 2023 compared to 2022. Fewer respondents preferred virtual over in-person visits for minor illness care (down 2pp), chronic condition care (down 4pp), annual wellness visits (down 3pp), emergency care (down 4pp), and physical therapy (down 2pp).
There are many possible explanations for why consumers’ preferences for virtual care, compared to in-person care, changed in these contexts. They could relate to cost (e.g., virtual visits could cost more or be paid out-of-pocket, while in-person appointments might be covered by insurance), or to whether a consumer already has a relationship with an in-person provider. Another important reason relates to the realities of convenience. Virtual solutions for primary, on-demand, and chronic condition care often tout convenience as their competitive edge, compared to in-person solutions. However, while virtual care might be more convenient than legacy in-person offerings like getting an appointment at a doctor’s office, digital health players are facing competition from in-person care primary, wellness, and chronic care programs at retailers, grocers, and tech-enabled clinics. These non-traditional players are building out offerings that have neighborhood locations, drop-in hours, and bundle healthcare with other routines like grocery shopping. Accessing these care sites may feel as convenient (e.g., running to the local grocery store for a care appointment) as scheduling a virtual appointment.
For virtual care players, continuing to compete on convenience involves addressing the full competitive set, which includes easy-to-access physical locations and on-demand care. It also means strategizing for convenience, which requires considering when and where virtual is really more convenient than the best in-person offering, and when it makes sense to partner with everyday locations like grocers or retailers rather than competing with them. Virtual players must also consider how to compete on other value drivers beyond convenience, including factors such as communication (e.g., always-available chat), cost, insurance coverage, and access to culturally-competent care.
Consumers are familiar with at-home COVID-19 diagnostic testing, but adoption hasn’t yet translated to other test types
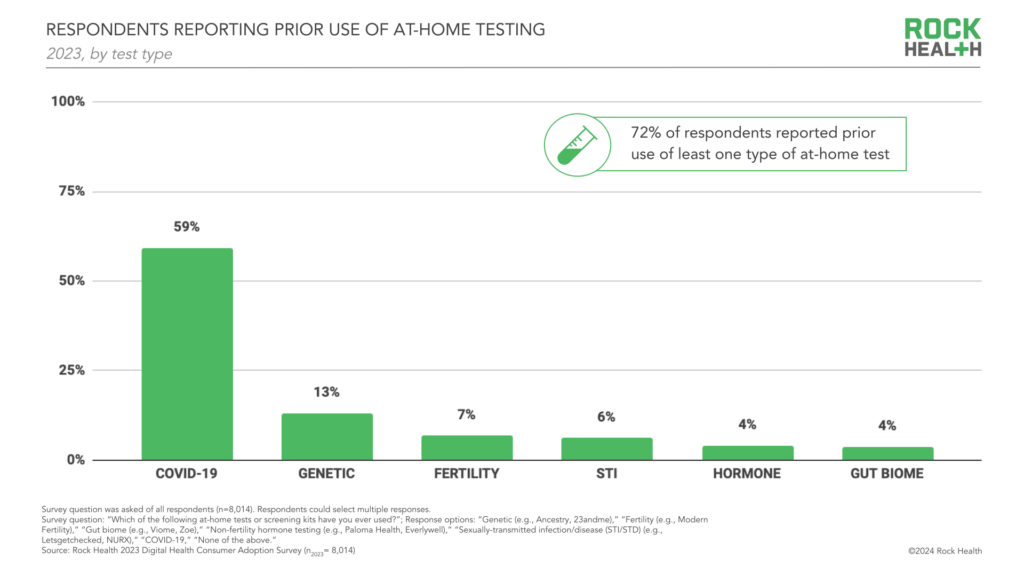
2023 was the first year we asked Survey respondents about their use of various at-home diagnostics, and 72% of respondents reported prior use of at least one type of at-home test for results on fertility, gut biome, non-fertility hormones, STI/STD, and/or COVID-19. Yet, among respondents who had taken an at-home test, 64% of respondents had exclusively taken a COVID-19 test, indicating that COVID-19 testing is the primary driver of overall at-home testing adoption rates.
Many factors contributed to COVID-19 testing reaching a national scale. During the pandemic, the tests were low or no-cost, and there were widespread testing requirements for schools, work, and events—not to mention daily COVID-19 headlines that kept testing top-of-mind. The nasal swab form factor, at-home process (no need to send samples to a lab), and near-instant results made the test easy to use and interpret. These unique features pushed forward adoption at an unprecedented pace, and one that has proven to be the exception, rather than a reflection of at-home testing trends.
While many consumers are now acquainted with at-home testing, this familiarity hasn’t yet translated to demand for other healthcare test types. For example, while genetic testing was the second most used type of at-home test, only 13% of respondents reported prior use—a 46pp difference compared to COVID-19 test use. The “one-and-done” nature of at-home genetic tests may inhibit demand growth, unless consumer genetic testing players can integrate and deliver value across a consumer’s healthcare journey, which some players have struggled to do in the past.
Lessons from the success of COVID-19 testing, as well as broader consumer virtual care trends, can help guide product development and go-to-market decisions for healthcare leaders innovating in consumer diagnostics, test-to-treat solutions, or patient insight memberships. By prioritizing user-first design, cost, and ease-of-access, consumer testing players could have more room to play in emerging trend areas like obesity care. Investing in long-term diagnostic engagement will be especially important for innovators piloting new test types or expanding tests across therapeutic areas.
Though consumers are willing to share their health data, they’re becoming more discriminating about whom they’re willing to share data with
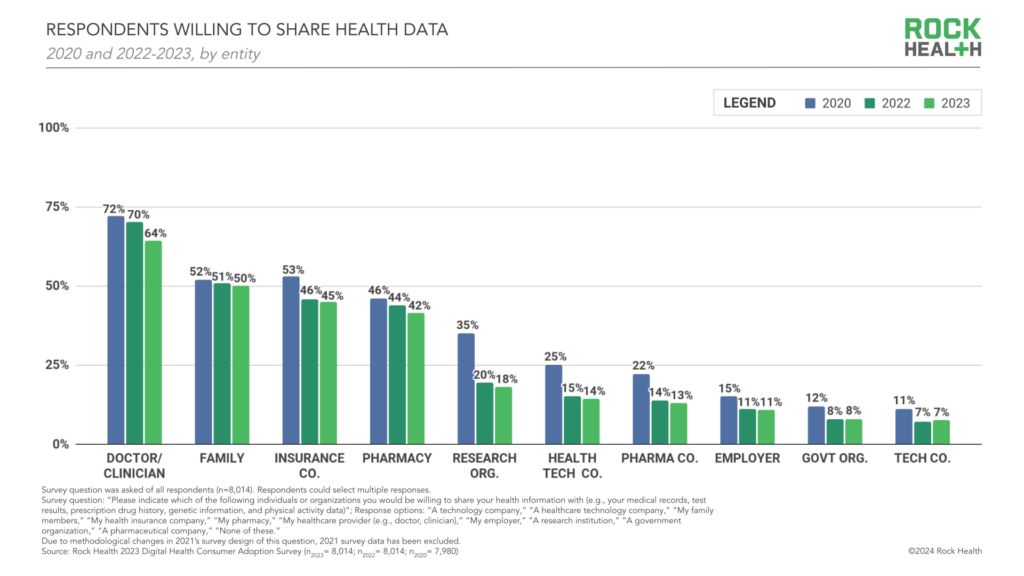
Patient data is central to the healthcare ecosystem; it helps inform new treatments, model out disease trends, and train AI models for patient care and support, just to name a few. A large majority of Survey respondents (90%) reported that they are willing to share their own healthcare data with at least one entity (e.g., clinician, family member, pharmaceutical companies), a consistent trend from 2022 (91%) and 2020 (90%).3
However, in 2023, the proportion of respondents willing to share data with particular entities dropped across almost all entity types, suggesting that consumers are sharing their data with fewer entities over time. On average, consumers were willing to share their health data with 2.7 entities in 2023, down from an average of 3.4 entities in 2020. It’s worth calling out that the greatest year-over-year drop in the proportion of respondents willing to share data was with a doctor/clinician. Sixty-four percent of respondents were willing to share health data with a clinician, down from 70% in 2022.
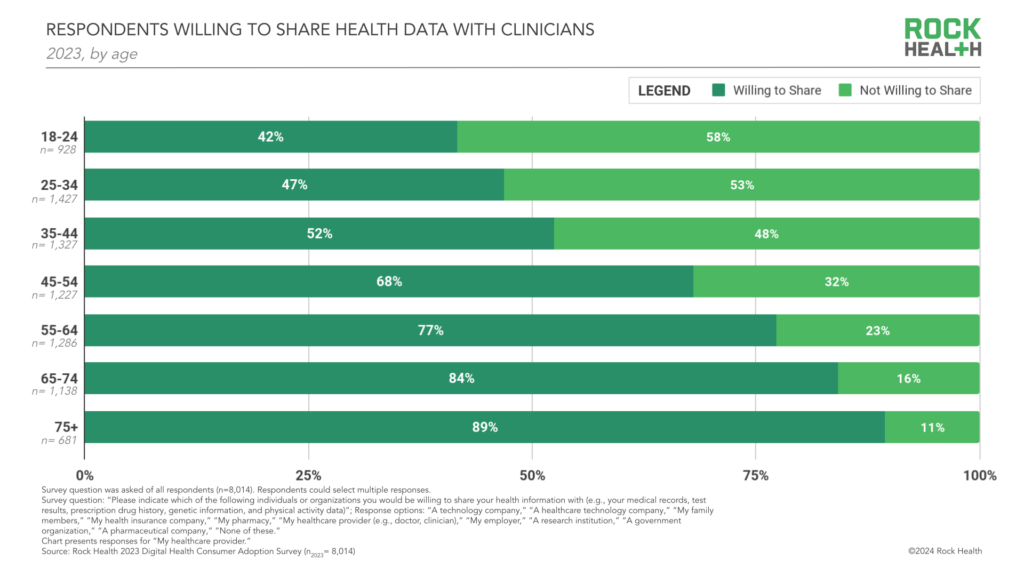
There were notable differences in the proportion of respondents willing to share data with clinicians by respondent age and race or ethnicity, which suggests that lived experiences are influencing data-sharing patterns. Another contributing factor to the decline may be Americans’ shrinking relationships with healthcare providers. Nearly a quarter of Americans are without a primary care provider, with young people and communities of color especially unlikely to have long-term relationships with a primary care physician.
Only 42% of respondents aged 18-24 indicated they’d share their data with a clinician, compared to 89% of the oldest respondents (age 75+), a striking difference of 47pp, especially given that younger generations are more tech-connected. Young people may have fewer opportunities to share data with clinicians and are less familiar with the benefits of doing so. With fewer years of health history and lower disease burden, young adults might see less benefit in building relationships with clinicians, which could contribute to data-sharing hesitancies.
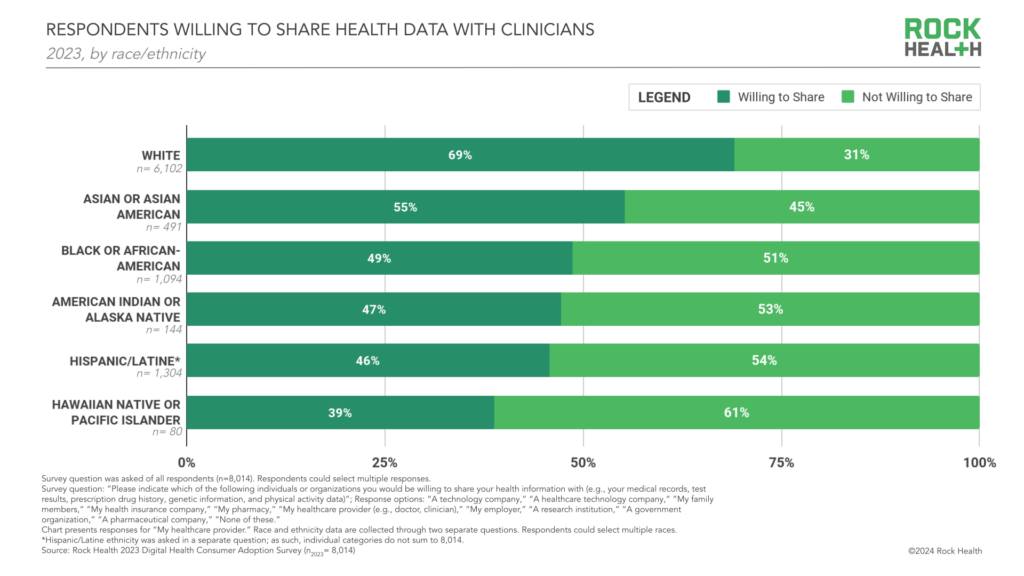
We also noted important differences in the proportion of respondents willing to share health data with a clinician by respondents’ race and ethnicity. Hawaiian Native (39%), Hispanic/Latine (46%), American Indian or Alaska Native (47%), and Black respondent (49%) groups had the lowest proportions of respondents willing to share their data with a clinician—in stark contrast to white respondents (69%). Given histories of medical racism, discrimination in care experiences, and racial bias in healthcare technology, it’s not surprising that these respondents may not see value in sharing data with clinicians, or have concerns about the privacy and safety implications of doing so.
Though many people share data with healthcare (and non-healthcare) players without knowing it, consumers’ growing reluctance to share their healthcare data is an opportunity and a warning for the sector. There’s an unmistakable need to address concerns and invest in trust-building around data sharing and stewardship. Part of this involves ensuring data safety and security; consumers are aware of recent healthcare cyberattacks and will be looking to healthcare organizations to invest in data security as part of their commitment to patients. Another component is for healthcare players to show consumers how data sharing supports or improves their experience—whether by helping personalize care decisions or tailoring educational content, support materials, or even shopping recommendations. Building trusted relationships around data sharing will only become more important. Players that earn consumers’ data-sharing confidence will have stronger footing for long-term relationships.
Conclusion
Our 2023 Survey gives strong signals that we’ve entered a new era of virtual care, where digital health is familiar and consumers are weighing their options to decide when, where, and how to engage with available virtual care offerings. Rather than committing to any one care channel (virtual, in-person, or hybrid), consumers are considering a range of priorities like convenience, user-friendliness, and data security in their decision-making. Innovators will need to prioritize refining omnichannel care offerings, investing in user-first design, and adopting transparent data use and management practices—priority areas we think benefit consumers and the healthcare ecosystem alike.
Ready to dive into nine years of consumer insights?
Reach out to Rock Health Advisory to dig even deeper into our longitudinal Digital Health Consumer Adoption Survey dataset. With guidance from our team, explore questions like:
- What are the top drivers of consumers’ wearable use, and how have these drivers changed over time?
- How are digital tracking patterns evolving among respondents living with different chronic illnesses (e.g., obesity, diabetes, cancer, sleep disorders, immunological conditions)?
- Which technology companies are respondents most willing to share their health data with? How have these trends changed?
Tap into insights and strategic guidance for enterprise companies with Rock Health Advisory.
Get in touch with the venture team at Rock Health Capital.
Join us in building a more equitable future at RockHealth.org.
And last but not least, stay plugged into the Rock Health community and all things digital health with the Rock Weekly.
Footnotes
- Survey respondents (n=8,014) are Census-matched by gender, age, U.S. region, race/ethnicity, and annual household income. The Survey was administered from October 12, 2023 to November 30, 2023. Respondents used their personal desktop, laptop, smartphone, or tablet to complete the survey in English.
- Our Survey methodology primarily samples new respondents each year; 6% of 2023 Survey respondents participated in a prior version of this Survey. Due to this methodology, some variation in “ever use” is to be expected.
- Due to methodological changes in the 2021 Survey design of this question, 2021 Survey data has been excluded.