


Startup innovation for underserved groups: 2021 digital health consumer adoption insights
Thank you to the Stanford Center of Digital Health for their continued collaboration on this work, with special gratitude to co-authors Natasha Din, MD, Clark Seninger, MBA, Zahra Azizi, MD, Sravya Rallapalli, Ashish Sarraju, MD, James Tooley, MD, Krishna Pundi, MD, Mario Funes-Hernandez, MD, and Mintu Turakhia, MD.
The past two years of the pandemic have made clear that realizing the potential of virtual care delivery nationally requires innovating around the health needs and barriers of individual communities of Americans, many of whom are forced to navigate deep-rooted patterns of injustice, including within our healthcare system. Continuing to tackle these barriers is a multi-faceted endeavor that requires tight-knit collaboration across the healthcare system, public health efforts, city infrastructure, policy gurus, and the many more stakeholders who touch the varied social and economic determinants of health. In this piece, we take a look at how digital health is being used across particular user groups, specifically those who have been marginalized from the healthcare system and carry the disproportionate impact of access and outcome disparities: (1) rural communities, (2) those with Medicaid insurance coverage, (3) women of color1, and (4) LGBQA+ and transgender-identifying individuals.2 In addition to analyzing adoption patterns, we also highlight select innovators and startups devoted to advancing equity in digital health for these particular populations.
Every year since 2015, Rock Health has surveyed thousands of U.S. adults aged 18+ to uncover trends in how people are using and engaging with digital health products and services. Rock Health’s 2021 Digital Health Consumer Adoption Survey (hereto referred to as the “Survey”), completed in August 2021 among 7,980 adult consumers is our seventh annual U.S. census-matched survey.3 Our hope is the Survey data sheds light on where digital health solutions are gaining traction across different demographic groups—and where gaps still remain.
Before we dive into the analysis, we wanted to share a bit about the Survey methodology, which impacts our sample of respondents and ability to extrapolate insights on particular groups. Respondents used their personal desktop, laptop, smartphone, or tablet to complete the Survey in English, meaning the Survey undersamples those without digital devices and regular internet connectivity, as well as non-English speakers. Further, our Survey did not assess respondents’ physical or intellectual disability status, or immigration/refugee status. Given this survey design and deployment, this piece is not intended to represent all communities—nor be the arbiter of digital health-related behavior on any given demographic group. Rather, we wish to use this data to start conversations and prompt further research. Throughout each section, we will put consumer adoption survey trends among four populations in context of the specific access and outcomes barriers faced by these groups–highlighting the startup innovation centered around improving trust, quality, and accessibility of healthcare among these populations.
Bringing hybrid care to rural households
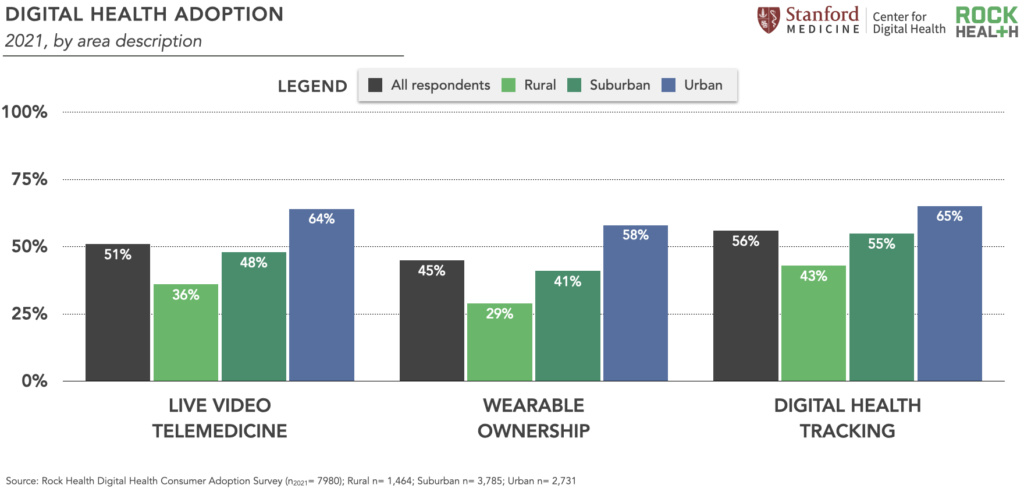
For rural Americans, ready access to healthcare is a longstanding challenge. Many of the first U.S. virtual care initiatives were rooted in improving rural access to healthcare, and the COVID-19 pandemic catalyzed additional funding for rural digital health expansion. However, our 2021 Survey data indicate that digital health adoption gaps persist in rural communities, with respondents living in rural areas reporting lower rates of live video telemedicine use, wearable ownership, and digital tracking of health metrics than their suburban and urban counterparts.
The past several months have seen digital health startups rise up to continue tackling the rural care gap. Many recent initiatives focus on empowering the rural care workforce. Rural clinicians are linchpins of community health, though their numbers are historically limited: while 20% of Americans live in rural areas only 11% of clinicians do, and they’re likely feeling the effects of healthcare’s Great Resignation. Our 2021 Survey data also show that compared to respondents living in urban areas, rural residents were more likely to trust health information provided by a doctor or clinician4, and a greater percentage of rural residents trust health information from a doctor (88%) than from an online website/app (52%).5 This reinforces the role that rural clinicians play in bridging community trust gaps, and the need to invest in digital infrastructure for these providers.
Startups empowering rural care teams most often integrate digital and in-person touchpoints for quality hybrid care. Main Street Health, which raised $26M in June 2021, pairs rural Medicare Advantage beneficiaries with local health navigators (social workers, LPNs,6 pharmacy technicians) who are available for virtual or in-person meetings to coordinate chronic care needs. In another hybrid approach, Origin Healthcare integrates remote patient monitoring with mobile care teams to deliver hospital-level care to rural patients in their homes.
Digital health players are also helping clinicians overcome infrastructure barriers remaining for rural care delivery. As rural areas continue to have lower rates of broadband access, hybrid care delivery startup Homeward Health (launched in March 2022 with $20M) designed their virtual care and remote monitoring platform to rely on cellular networks which are more widely-available than broadband; they also supplement virtual connections with mobile care units for in-person visits in a patient’s home.
We’re excited by the care delivery approaches we’re seeing from today’s rural-focused digital health startups and expect to see more innovation here—especially as value-based care models gain traction across providers nationwide. But individual companies’ initiatives must be paired with continued federal and state investment in digital infrastructure and affordability measures for dispersed communities, such as the Affordable Connectivity Program which will lower internet costs or increase speeds for 48 million households, in order for digital care avenues to take hold in rural America.
Virtual care explicitly tailored to Medicaid members
With nearly 80 million beneficiaries and $671B in annual spend, Medicaid represents about 20% of our national health expenditure—making it a key innovation focus area for healthcare leaders. Notably, Rock Health 2021 Survey data shows that respondents enrolled in Medicaid reported using digital health tools at similar rates to the Survey average; compared to other insurance cohorts, Medicaid beneficiaries were “middle of the pack” digital health users, as seen in the graph below. This data helps to reinforce important perspective shifts that make the case for deepened digital health investment for Medicaid communities. To quote the California Health Care Foundation, “Myths have been shattered that people with low incomes or disabilities won’t use health care technologies, that providers would not invest in them, or that serving these patients with new tools could not be financially viable.”

Diving deeper, Survey respondents enrolled in Medicaid reported using telemedicine modalities beyond live video at slightly higher rates than the Survey average, including live phone telemedicine (50% compared to 45% Survey average) and text messaging with a clinician (32% compared to 28% Survey average). To us, this data emphasizes the importance of designing digital health solutions that offer care touch points across tech channels and modalities, from texting and phone calls to mobile web and digital apps—meeting consumers in ways that are most secure, accessible, and cost-effective for them.
We’re following the work of virtual care providers like Galileo, which provides Medicaid members with 24/7 text- and video-chat care through its bilingual (Spanish and English) app, Icario Health, which recently launched their Digital Bridge program to improve digital literacy among Medicaid and Medicare beneficiaries and offer free or low-cost broadband, and Zócalo Health (launching summer 2022), which is designing an integrated virtual primary care model for Latinx millennials. On a larger stage, WhatsApp (owned by Meta) recently launched a chatbot for the California Department of Public Health to expand access to accurate health information and prevent spread of misinformation on social media, especially among Medicaid beneficiaries and the Latinx community.7 Not only do these communication pathways expand access to care and information, but they also consider patients’ preferences and lifestyles.
“Information exchange is a necessary start, but communication with specific user groups is also about relationship-building, which must be done by communicating with an understanding of how culture, social, and family values impact how people make decisions.”
– Erik Cardenas, Co-Founder and CEO, Zócalo Health
Beyond product design, recent raises from startups Waymark ($45M) and Clinify Health ($3.1M) support Medicaid care delivery hubs including community health programs and Federally Qualified Health Centers—and we’re excited to see further innovation supporting these community-based care networks. However, startup work must also be paired with digital health literacy support and policy changes for Medicaid care improvement, including expanding Medicaid coverage, simplifying enrollment and administration, and extending reimbursement and payment parity for different modalities of telemedicine, particularly those used at higher rates by Medicaid members.
Digital health solutions that prioritize fostering trust with women of color
Women historically have been the most active healthcare utilizers: they use preventive care services at higher rates than men, and working-age women incur healthcare expenses at least 80% higher than their male peers. Despite higher healthcare usage, women have worse health outcomes for some conditions and were more likely to forgo care at the height of the pandemic compared to men. Research shows that quality of care and clinical care outcomes are even worse for women of color, with higher disease incidence, increased maternal mortality rates, inefficient pain management, and shorter life expectancies.
Increasingly, digital health players want to understand and meet the needs of women. According to Rock Health Survey data, between 2015 and 2020, women respondents consistently reported lower adoption of digital health tools compared to men respondents,8 but in 2021, that trend changed—women reported adoption rates nearly equal to men,9 with significant jumps in live video telemedicine use and wearable ownership.10
In analyzing the use of live video telemedicine, we did not find any statistically significant differences in adoption among women of different races and ethnicities. We’re optimistic about the overall increased use of telemedicine by women—and use across races and ethnicities. A familiarity with digital health solutions sets a strong foundation for partnerships like that between Brave Health and the Doula Network, which provides pregnant women with virtual maternal mental healthcare. Their program in particular acknowledges that Indigenous American women experience a higher prevalence of postpartum depression compared to all women.
In reviewing the data for other digital health tools, women of color respondents reported higher use compared to women who only identified as white—perhaps demonstrating that women of color are seeking alternative healthcare experiences that better meet their needs and expectations.11 For example, Black women and Asian women respondents reported higher overall percentage rates of wearable ownership and digital health tracking compared to the survey average for all women, white-only women, and Indigenous women respondents.12
Other academic research articles have reported disparities in telemedicine use among different racial and ethnic groups. One telemedicine study analyzed claims data between March to November 2020 from Federally Qualified Health Centers and found that African Americans, Asians, and Indigenous Americans13 were significantly less likely to use telemedicine compared to white adults. The different results between our survey and others may reflect differences in surveyed populations and methodologies. And to us, this highlights the crucial role of continued research, as well as the importance of not solely relying on quantitative assessments of utilization and preference, but ultimately building alongside and with the communities being served.
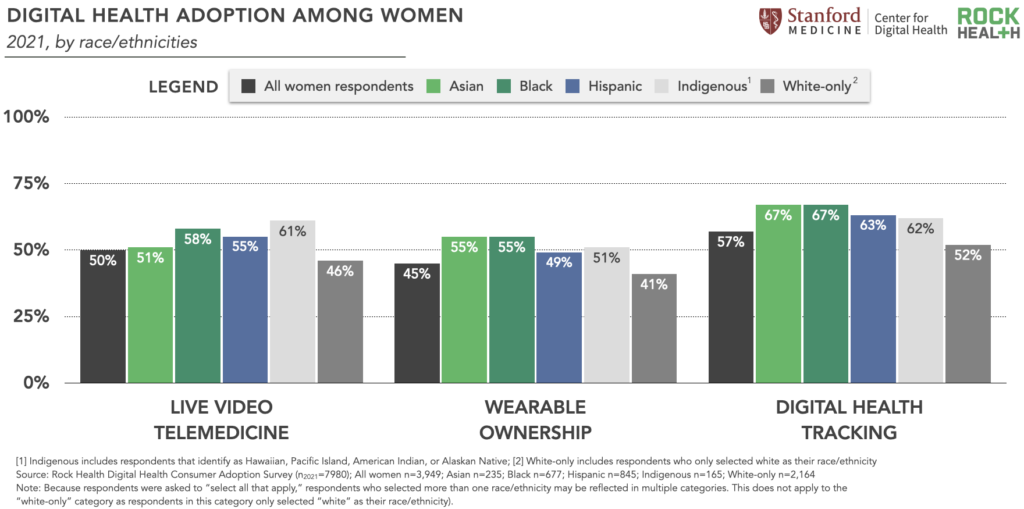
In the Rock Health 2021 Survey, satisfaction with and trust in digital health tools vary for women of different races and ethnicities. Despite relatively high usage rates, women respondents of color reported lower satisfaction with digital health tools than women who identified as white, particularly regarding their live video telemedicine experiences. For example, Indigenous American women (30%) and Asian women (35%) respondents reported the lowest rates of “extreme satisfaction” with live video telemedicine, while white-only women respondents reported the highest rate (55%).
While our Survey doesn’t answer the “why” behind these lower satisfaction levels, they may relate to disconnects between digital health product design and the communities of women using these solutions. As we’ve written about before, co-designing digital health solutions with the communities they plan to serve can help to mitigate utilization gaps and satisfaction breakdowns. Digital health startups innovating through a co-design lens include Radical Health, which organizes users into chat circles for online peer support in navigating healthcare journeys, and Grapevine Health, which creates educational health content centered in the voice of the community and delivers it at scale—through social media, online channels, and their “doctors on the street” campaign.
Women respondents of color also reported varying levels of trust in healthcare information provided by clinicians. For example, 83% of Black women and 84% of Indigenous American women respondents trust clinician-provided health information; the lowest reported rates of trust for this category, compared to white-only women (92%) and the overall Survey average for women (89%). Particularly for women of color, trust is central in re-orienting care relationships that have historically been rooted in violence, dismissal, or other forms of discrimination.
“Marginalization in care breaks down trust in provider relationships and can have far-reaching consequences that impact our health, the health of our babies, and our community at large. Mae’s platform, which serves Black expectant mothers and includes rigorous symptom tracking and maternal health support, endeavors to create more meaningful, trusted interactions between patients and their care teams. Digital tools can play a huge role in understanding the totality of a mom’s lived experience, allowing us to address needs more holistically, and fundamentally change how moms engage in care.”
– Maya Hardigan, Founder and CEO, Mae
We can look to Black women startup founders as leaders in trust-building within digital health experiences. Maya Hardigan, founder and CEO of Mae, focuses on delivering pregnancy and postpartum support tailored to Black women’s needs.14 And Ashlee Wisdom, co-founder and CEO of Health in Her Hue, who centers her startup on connecting women of color to culturally sensitive healthcare providers, evidence-based and culturally attuned health content, and community support. Key lessons from both founders: invest in care teams who reflect patients’ identities and experiences, center product design in patients’ unique care journeys, and don’t underestimate the power of community support.
Queer and trans competency in virtual care15
Last summer, we wrote about the startups tailoring products and service offerings to LGBQA+ individuals, as well as those who identify as transgender—two groups that report more discrimination in health settings and lower quality healthcare. More than one in six queer and transgender adults reported avoiding health care due to anticipated discrimination—and, according to Rock Health’s 2021 Survey, 85% of transgender respondents and 33% of LGBQA+ respondents delayed necessary medical care in 2021, compared to 20% of cisgender and 24% of heterosexual respondents.
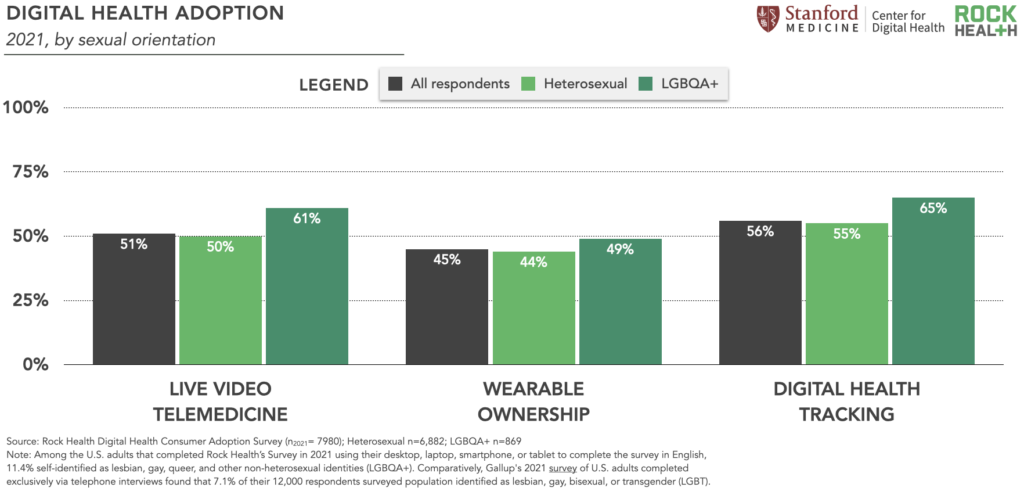
Given these communities’ histories of discrimination in clinical settings, digital health founders are building out virtual-first care pathways for LGBTQ+ communities. Digital health startups serving queer and transgender individuals raised $311M in 2021, the highest year on record, led by startups Folx and Plume. In tandem, we’re seeing high rates of self-reported adoption of digital care tools among queer individuals, which may signal an openness to digital-first care among this community. In 2021, LGBQA+ respondents were more likely to have used live video telemedicine, own a wearable, and digitally track at least one health metric compared to heterosexual respondents. For example, 61% of LGBQA+ respondents reported having used live video telemedicine (11pp16 higher than heterosexual respondents) compared to 50% of heteroseuxal respondents.17
The transgender community is closely connected to the LGBQA+ community but encounters unique, heightened risks for healthcare discrimination. Given the risk transgender individuals face in receiving healthcare in-person, this may encourage them to use (and ultimately prefer) digital-first pathways. Our 2021 Survey data show that trans respondents, compared to cisgender respondents, were significantly more likely to have used telemedicine–even after adjusting for age, income, education, insurance type, area of residence, gender identity, race, and chronic condition status.18 Respondents who identified as transgender reported significantly higher usage rates of three digital health tools: live video telemedicine (42pp higher than cisgender respondents), wearable ownership (48pp higher than cisgender respondents), and digital health tracking (28pp higher than cisgender respondents).
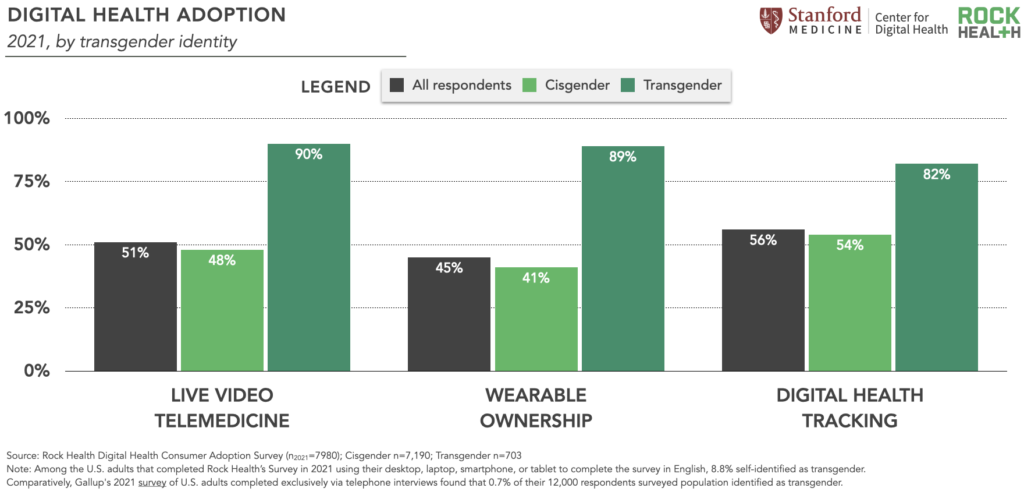
Trans respondents also reported extremely high trust and satisfaction levels with digital experiences: 90% trust health information from a website/app (compared to 60% of cisgender respondents), and 61% were more satisfied with their live video telemedicine interactions compared to a previous in-person visit (compared to 18% of cisgender respondents).
“The use of digital health is sometimes a proxy for lack of trust. If someone doesn’t have a trusted healthcare provider, they might be more willing to use electronic sources of information and/or digital health apps as a resource for their health questions and needs.”
– Kaakpema “KP” Yelpaala, Co-Founder and CEO, InOn Health
However promising these numbers are, there’s more to be done to improve care experiences for LGBQA+ and transgender individuals. Education-focused innovators such as Violet are partnering with healthcare organizations to train and credential providers on delivering culturally competent care for LGBQA+, trans, and women of color communities nationwide. LGBQA+ and trans visibility also necessitates evolving our healthcare record keeping, and we’re glad to see EHR leader athenahealth revamp its patient information display to include information such as pronouns, gender identity, and sex or gender assigned at birth to enable more tailored, gender-affirming care. We know that digital health alone won’t solve the care gap that LGBQA+ and transgender individuals experience, but with more queer- and trans-competent digital health companies in the market, we hope to see continued improvement in care access and experiences.
Continued investment and innovation for equity-minded digital healthcare
While we’re encouraged to see higher self-reported digital health usage rates in our Survey data, lower-than-average reported satisfaction and trust among historically marginalized communities underscore the importance of designing safe, accessible, and culturally attuned healthcare experiences. We’re excited to continue to support, learn from, and elevate the voices of the innovators and startups devoted to building solutions alongside the communities they intend to serve.
Want to dig even further into this longitudinal consumer adoption survey data? Reach out to advisory@rockhealth.com to learn more about the Rock Health Membership for healthcare enterprises.
To learn more about our work in supporting a more equitable digital health ecosystem, sign up for our RockHealth.org mailing list.
Stay up to date with the latest headlines in healthcare technology and Rock Health news by subscribing to the Rock Weekly.
Footnotes
- Women of color respondents in our Survey refer to respondents who identified as one or more of the following races and/or ethnicities: American Indian or Alaska Native, Asian, Black or African-American, Hawaiian Native or Pacific Islander, Hispanic or Latino/a/x, or “Other.” Women of color respondents also include those who selected “white” in addition to one or more non-white race or ethnicity.
- “LGBQA+” includes those who identified as lesbian, gay, queer, and other non-heterosexual identities. In Rock Health’s 2021 Consumer Adoption Survey, we ask a question about transgender identity separate from sexual orientation and gender identity.
- In both 2020 and 2021, 7,980 U.S. adults were surveyed between summer and fall; in previous years, we surveyed approximately 4,000 U.S. adults annually. For statistical analyses, we used logistic regression to determine the association between a primary predictor and outcome of interest, controlling for covariates (i.e., confounders) in multivariate regression analysis.
- After adjusting for covariates, respondents of suburban and rural residences in 2021, as compared to urban, were associated with greater odds of trusting health information provided by a doctor or clinician (suburban: OR:1.72; CI: 1.53 – 1.94; p<0.001; rural: OR: 2.01; CI: 1.71 - 2.37; p<0.001).
- Compared to urban, suburban and rural respondents in 2021 were less likely to trust health information provided by online health websites or apps (suburban: OR: 0.70; CI: 0.62-0.78; p<0.001; rural: OR: 0.55; CI: 0.47-0.63; p<0.001). Ninety-one percent of urban residents reported that they trust health information from a doctor and 73% reported that they trust health information from an online website/app.
- LPN is an acronym for a licensed practical nurse.
- The JMIR study found that the Medicaid population had significantly higher adoption rates for using social media for health information than their counterpart (8% higher in 2018, P=.01; 10.1% higher in 2019, P=.01).
- For context, in 2020, 35% of women respondents previously used live video telemedicine (compared to 51% of men), and 36% of women owned a wearable (compared to 49% of men).
- Among 2021 Survey respondents who were men, 53% reported previously accessing live video telemedicine and 44% owned a wearable.
- In 2021, 50% of women respondents reported previously accessing live video telemedicine compared to 35% in 2020, and 45% of women respondents in 2021 owned a wearable compared to 36% in 2020.
- Similar to live video telemedicine, when analyzing wearable ownership, there were no statistically significant associations by women across races/ethnicities in 2021.
- As discussed in footnote one, women of color respondents identified as one or more of the following races and/or ethnicities: American Indian or Alaska Native, Asian, Black or African-American, Hawaiian Native or Pacific Islander, Hispanic or Latino/a/x, or “Other.” Women of color respondents also include those who selected “white” in addition to one or more non-white race or ethnicity. Therefore, women of color respondents may be reflected in multiple categories (apart from white-only). For example, a woman respondent who identified as Black and Asian would be included in both the Black and Asian respondent groups. The “white-only” category includes respondents who only selected “white” as their race/ethnicity.
- Includes American Indians / Alaska Natives and other Pacific Islanders.
- Researchers analyzed 1.8 million Florida hospital births between 1992 and 2015 and found an association, not a cause and effect relationship, with their findings.
- Sampling and survey collection methods, differences in queer and trans definitions, and respondents’ willingness to self-identify across survey channels (e.g., via phone, asynchronously during an online survey) may impact how LGBQA+ and trans individuals are represented across different pieces of research. For example, Rock Health’s 2021 Consumer Adoption Survey respondents self-identified as queer and/or transgender at higher rates than national averages. Among 2021 Survey respondents (n=7,980 U.S. adults), 10.9% (869) self-identified as lesbian, gay, queer, and/or other non-heterosexual identities (LGBQA+), 8.8% (703) identified as transgender, and 1.7% (138) identified as both trans and LGBQA+. Accounting for respondents in all three categories, these respondents collectively represent 16.8% of the total Survey cohort. Among those who identified as LGBQA+, 15.9% also identified as transgender. Among those who identified as transgender, 19.6% also identified as LGBQA+. In our 2020 Survey (n=7,980 U.S. adults), 9.8% (781) of respondents self-identified with one or more of the following categories: gender non-conforming, non-binary, lesbian, gay, bisexual, or queer; the 2020 survey did not ask respondents whether they identified as transgender. Survey respondents used their desktop, laptop, smartphone, or tablet to complete the survey in English. Comparatively, Gallup’s 2021 survey of U.S. adults completed exclusively via telephone interviews found that 7.1% of 12,000 respondents identified as lesbian, gay, bisexual, or transgender (LGBT).
- The acronym “pp” equates to “percentage points.” A percentage point is the numerical difference between two percentages, whereas a percentage is a number or ratio expressed as a fraction of 100.
- Compared to heterosexual respondents, LGBQA+ respondents in 2021 were more likely to have used live video telemedicine (OR:1.56(95%CI:1.35 to 1.80), P<0.001), own a wearable (OR:1.22(95%CI:1.06 to 1.40), P=0.005), and digitally track at least one health metric in 2021 (OR:1.52(95% CI: 1.31 to 1.76), P<0.001).
- Compared to cisgender respondents, transgender respondents in 2021 had significantly greater odds of telemedicine usage after controlling for covariates (OR: 3.38; CI: 2.27-5.06; p<0.001).